


Getting Started with Lynxtron
Welcome to the Lynxtron documentation! We will create a Lynxtron project and start developing.
Want to try Lynxtron before creating a full project? Download Lynxtron Go to edit and run templates and showcases immediately.
System Requirements
Before you begin, ensure your development environment meets the following requirements:
- Node.js:
^22.18.0 || ^24.0.0 || ^26.0.0. You can check your version by runningnode -v.
Optional Debugging Tools
- AI and CLI debugging: Use
agent-lynxto inspect and debug Lynx UI from a coding agent or the command line. - Graphical debugging: Use Lynx DevTool for Lynx UI, or Chrome DevTools for Node.js code running in Lynxtron.
Create a Project
It is recommended to quickly create a Lynxtron project by executing the following command:
Follow the prompts to create a Lynxtron project.
The generated project includes an AGENTS.md with development and debugging instructions for coding agents. Open the project in your coding agent to get started, or follow the steps below to develop manually.
Start Development
- Navigate into your Lynxtron project:
-
Install dependencies:
-
Start the application:
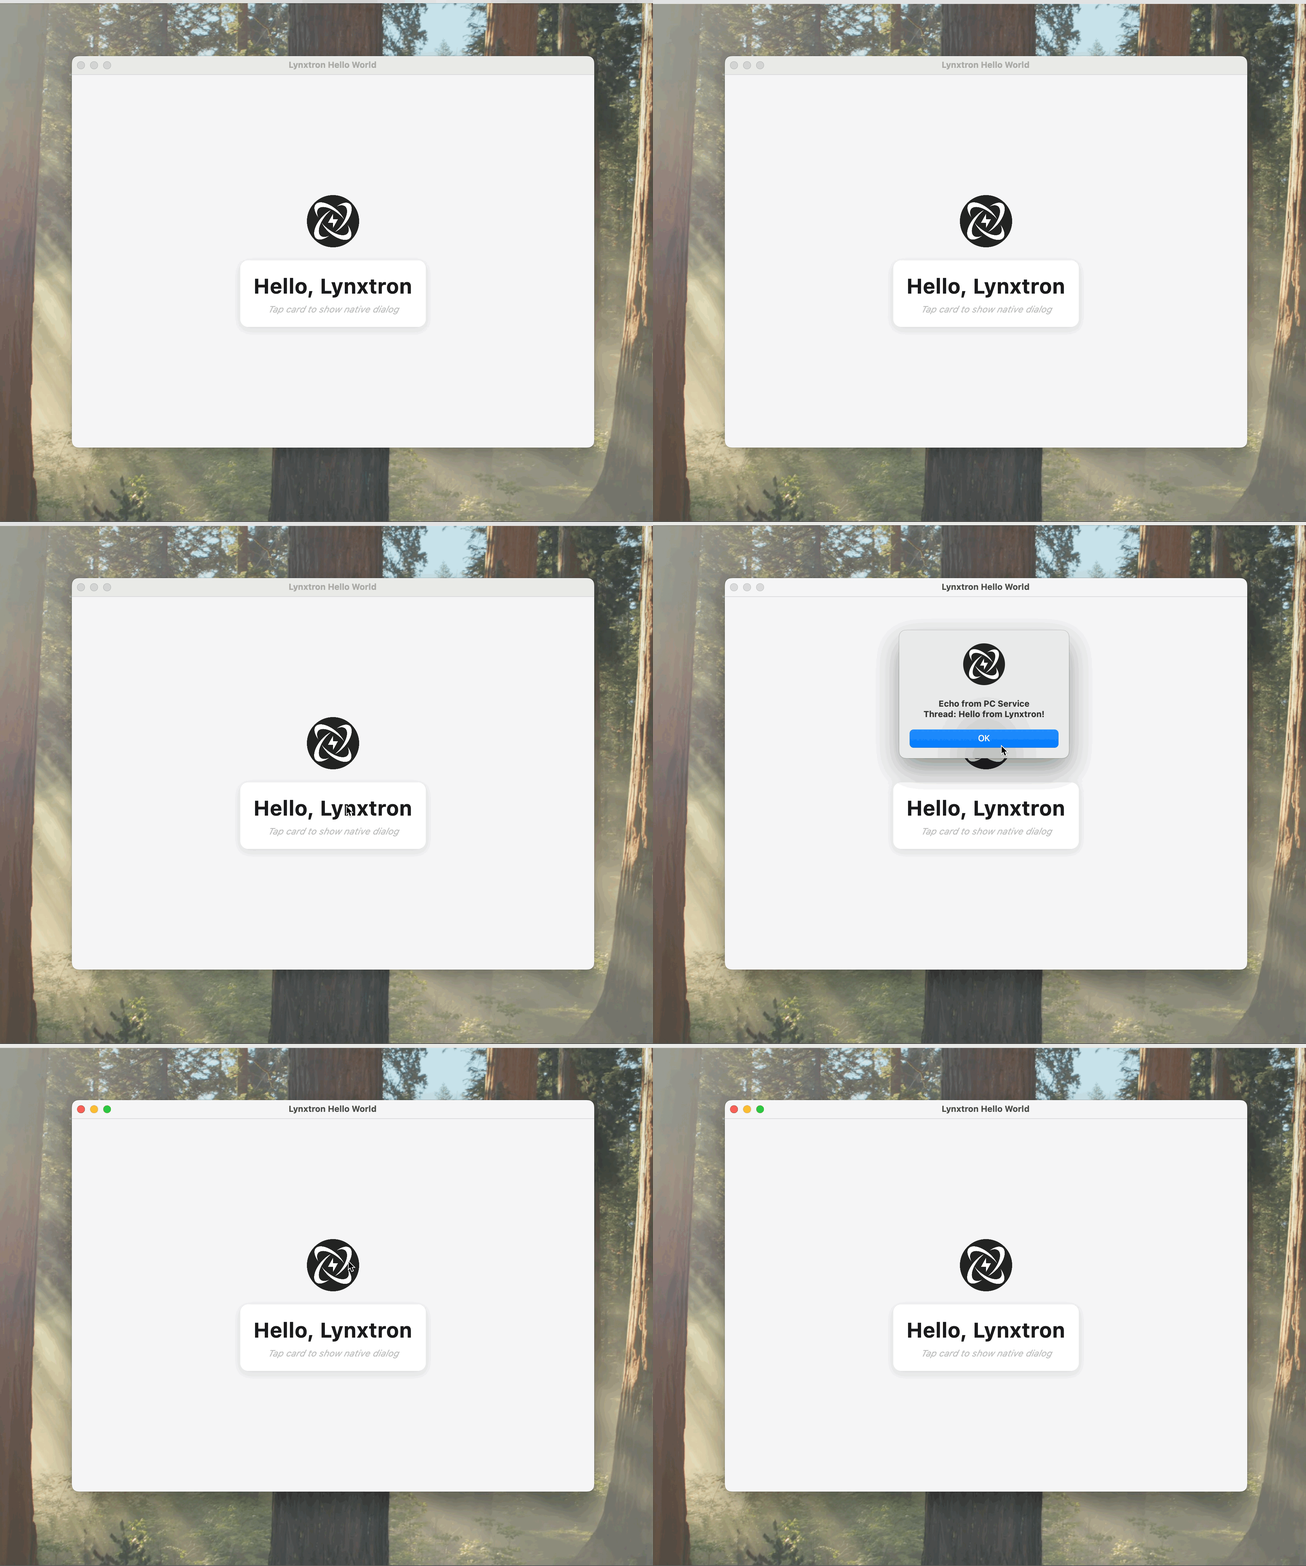
After running, you will see the Hello Lynxtron application launch successfully, as shown below:
Debug Your Application
The development command uses a DevTool-enabled Lynxtron runtime by default. Keep it running while you debug the main process or Lynx UI.
Debug with a Coding Agent or the CLI
The agent-lynx CLI exposes the same connection to scripts and coding agents. With the development command still running, you can discover the Lynxtron client, inspect its UI tree, read console output, or capture an annotated screenshot:
agent-lynx includes the official lynx-devtool skill. A coding agent can discover and load its complete instructions directly from the CLI:
The skill teaches the agent how to select clients and sessions and use DevTool commands for inspection, interaction, logs, sources, and screenshots.
Debug the Lynx UI with Lynx DevTool
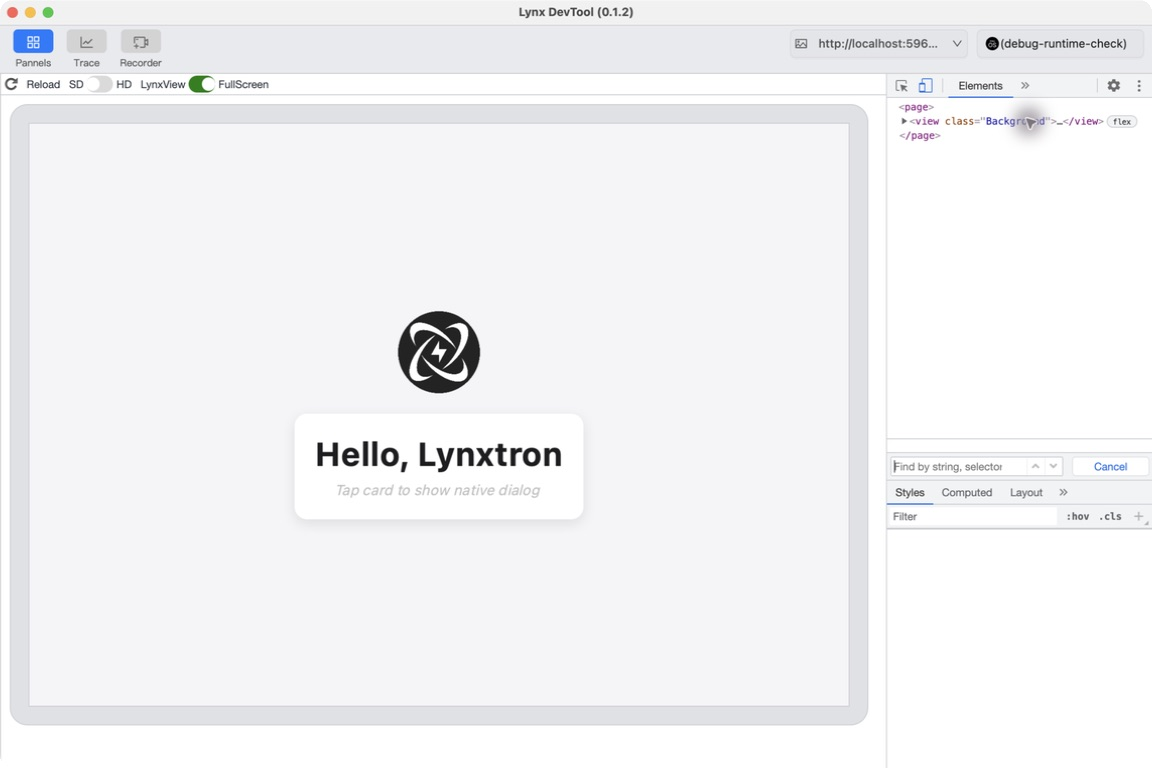
Download and open Lynx DevTool, select the running Lynxtron application, then inspect its elements, console output, and source code.
Debug Node.js Code with Chrome DevTools
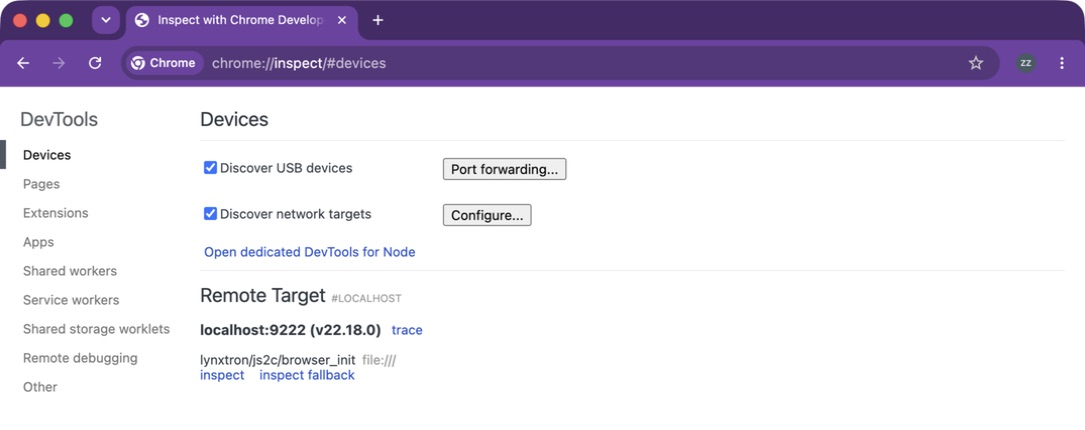
The development command starts the Node.js inspector on localhost:9222.
- Open
chrome://inspectin Chrome. - Select Configure... and make sure
localhost:9222is in the target discovery list. - Find the Lynxtron process under Remote Target, then select inspect.
Package Your Application
You can use the following command to package your application:
pack uses the release runtime by default. To create a DevTool-enabled package for local debugging, add this top-level option:
Remove this option before distributing the application.
Open the packaged application and connect with Lynx DevTool in the same way as during development.
If the session list is empty on the first CLI connection, quit and restart the app. The CLI enables DevTool when it connects, but existing windows need to be recreated. Run agent-lynx list-clients again after restarting and select the current client address.
If you need to configure some custom parameters, you can modify the electron-builder.yml configuration file.
For detailed configuration parameters of electron-builder.yml, please refer to electron-builder Configuration.