Performance Profiling
ReactLynx provides built-in profiling support to help you analyze and optimize the performance of your applications. This feature allows you to trace component rendering, diffing, and state updates in production builds.
Overview
When profiling is enabled, ReactLynx automatically instruments the following operations:
Enabling Profiling
Profiling is automatically enabled when the Lynx engine's profile recording is active. ReactLynx checks lynx.performance.isProfileRecording() at runtime to determine whether to enable profiling instrumentation.
To start profiling, you need to enable profile recording in the Lynx engine. For detailed instructions on how to record and view traces, see Recording Traces.
This feature requires Lynx 3.0 or later, which provides the necessary profiling APIs:
lynx.performance.profileStart()lynx.performance.profileEnd()lynx.performance.profileMark()lynx.performance.profileFlowId()lynx.performance.isProfileRecording()
Understanding Trace Events
Render Traces
The ReactLynx::render::ComponentName trace measures the time spent executing your component's render function. This helps identify components with expensive render logic.
Diff Traces
The ReactLynx::diff::ComponentName trace measures the time ReactLynx spends comparing the previous and new virtual DOM for a component. High diff times may indicate:
- Large component trees
- Frequent unnecessary re-renders
- Complex nested structures
diffFinishNoPatch Traces
The ReactLynx::diffFinishNoPatch is an instant event that fires when a component finishes diffing but produces no patch. This event includes a componentName argument indicating which component's diff produced no changes.
This trace is useful for identifying unnecessary re-renders. If you see many diffFinishNoPatch events, it means components are frequently re-rendering but not actually producing any UI changes. This is an optimization signal that you may need to:
- Use
React.memooruseMemoto prevent unnecessary re-renders - Check if parent components are passing unstable props (e.g., creating new objects or functions on every render)
- Optimize state management to avoid unnecessary state updates
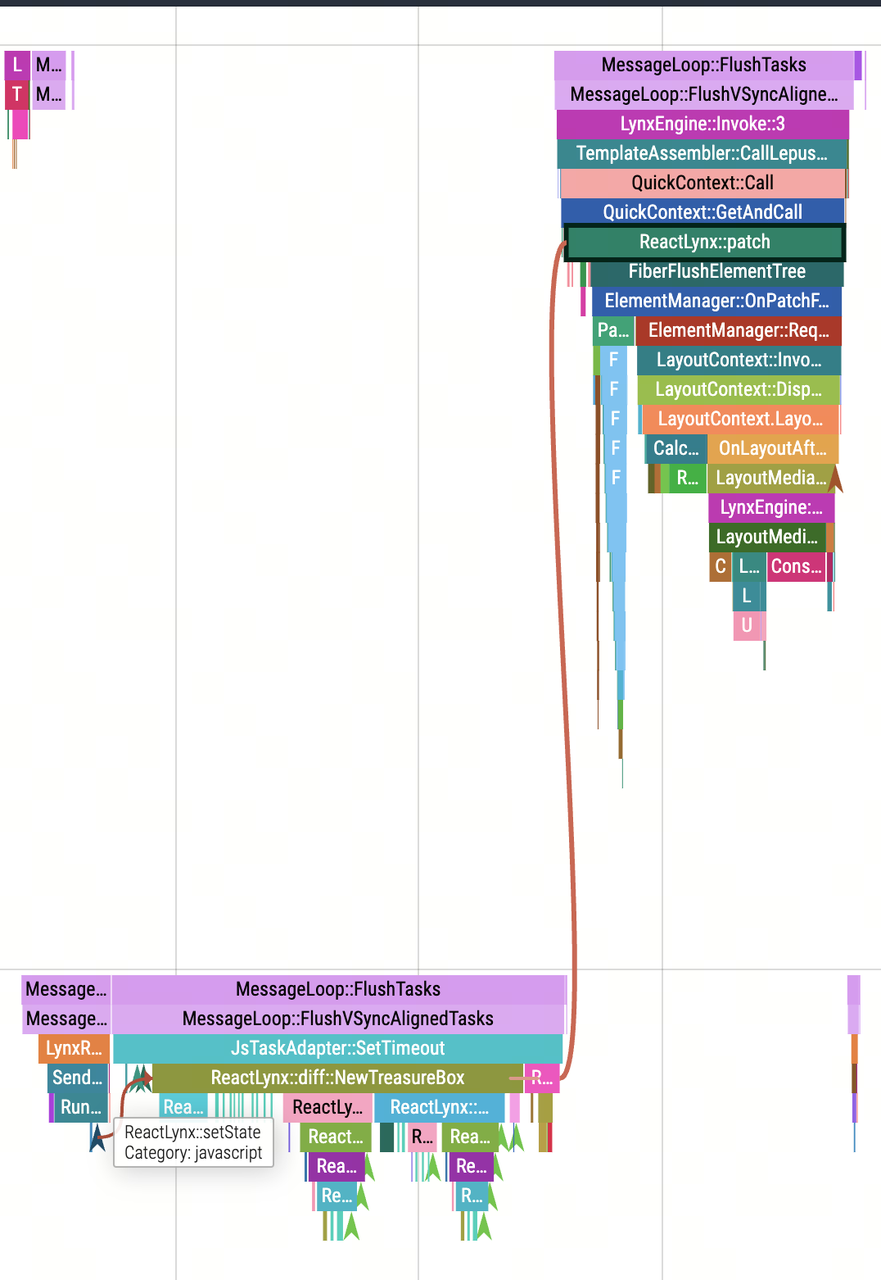
setState Traces
The ReactLynx::setState trace is an instant event that marks when setState is called. It includes additional metadata:
current state keys: Keys present in the current statenext state keys: Keys present in the next statechanged (shallow diff) state keys: Keys whose values changed
This helps you understand what triggered updates and which state properties changed.
Flow ID Tracking
ReactLynx uses flow IDs to connect related trace events. When you call setState, a flow ID is generated and attached to all subsequent operations (diff, commit, patch) triggered by that state update. This allows you to trace the complete flow of an update through the system.
Improving Component Name Readability
In production builds, component names may be minified and become unreadable (e.g., ReactLynx::render::t instead of ReactLynx::render::MyComponent).
To preserve readable component names, set the displayName property on your components:
If you encounter side effect issues during build
Build tools may treat setting displayName as a side effect, which can affect Tree-Shaking optimization. In this case, you can use the following pattern to avoid side effects:
Using this helper function:
Best Practices
-
Profile in realistic conditions: Test with production builds and realistic data to get accurate measurements.
-
Focus on hot paths: Pay attention to components that render frequently or handle large amounts of data.
-
Use displayName: Always set
displayNamefor components you want to profile, especially in production builds. -
Analyze flow IDs: Use flow IDs to understand the complete lifecycle of state updates, from
setStateto final patch. -
Look for patterns: Identify components with consistently high render or diff times as optimization candidates.