
Map Production Errors to Source
A production Lynx error reaches your monitoring as a minified, bundled stack. For example (large fields shown as ...):
Every position points into a bundle, never at the .tsx you wrote, and
main-thread.js:23:13 is trickier than it looks. It is printed like a
line:column, but the main thread runs as bytecode, so the two numbers are
actually function_id:pc: function 23, program-counter offset 13. That is a
location inside the bytecode, not a source line. (background.js:247:77 is a
real line:column.) This guide maps both back to your source (file, line,
column).
Lynx bundles everything needed for that into one debug-metadata.json per
build: the source maps, bytecode debug info, UI source map, and build metadata.
It is produced by
@lynx-js/debug-metadata-rsbuild-plugin
and auto-registered by
@lynx-js/rspeedy (enabled by
default; no config needed).
What lands on disk
One unified file per entry, under the entry's intermediate directory
(.rspeedy/<entry> by default):
In a production build the file is emitted and then deleted from the output. It is
not meant to ship with your app; it is just a debugging artifact. It stays on
disk only
in dev, or when DEBUG contains rspeedy (e.g.
DEBUG=rspeedy pnpm build, handy for inspecting the file locally). To use it
for production error mapping, upload and host it yourself (see
Using it in production).
The DebugMetadata file
It matches the DebugMetadataAsset type from
@lynx-js/debug-metadata:
Each Artifact carries a debugSources[] array ordered for the
decode chain:
bytecode-debug-info(if present) maps a bytecode position back to encoded JS(line, column).source-mapthen maps that back to your authored source.
Abbreviated (large values shown as ...), a real file looks like this. Note the
per-chunk source-map key, which is the release the runtime reports:
What bytecode-debug-info is
Lynx runs your main thread script as PrimJS bytecode, not the JS text on
disk. So when the main thread throws, the engine can only report where in the
bytecode it happened: a function_id:pc pair (a function index plus a
program-counter offset), not a line and column you'd recognize.
bytecode-debug-info is the lookup table that closes that gap. It maps a
function_id:pc back to a (line, column) in the encoded main-thread.js.
That position is still generated code, so the source-map then takes the second
step to your original .ts / .tsx. The two steps
(bytecode-debug-info and source-map) live in the same Artifact.
Background-thread JS runs normally, so its frames already carry real (line, column) positions and need only the source-map step, with no bytecode step.
The community
lynx-debug-info-remapping
skill takes a function_id:pc backtrace plus this file and prints the original
source positions with code context, so you don't have to write your own decoder.
Dev-server endpoints
During dev, the plugin serves the file and lets you query a single field
without parsing the whole thing:
In dev the plugin also rewrites the bundle's sourceMappingURL trailers and the
tasm templateDebugUrl / debugMetadataUrl to point at these dev-server
endpoints, so devtools resolve sources automatically.
Queryable fields
A match returns the field's content directly (e.g. ?field=source-map returns
the raw v3 map, not a wrapper object). Unknown fields return 400; a registered
field with no matching value returns 404.
Using it in production
Lynx defines the format and produces the file; it does not host it. There is no built-in upload, and the URL rewrites above only happen against the dev server. You wire up production yourself, and there are two models depending on how your stacks find their metadata:
- Model A, backend keyed by release: upload the file to your own service at
build time. The build already injects a
releaseinto the bundle (the runtime reports it on error) and embeds the same key in the file, so your backend indexes by it and mapsrelease → fileat error time. Nothing extra is injected into the bundle. - Model B, point the bundle at your host: also inject
debugMetadataUrl/templateDebugUrlinto the shipped template (and rewrite the JSsourceMappingURLtrailers) so devtools or your error-monitoring service can fetch the file directly.
Model A: upload and store
The default plugin deletes debug-metadata.json at the very end of the build
(PROCESS_ASSETS_STAGE_REPORT + 1). Tap one stage earlier to read it and hand
it to your uploader:
plugins/upload-debug-metadata.ts
Wire it into lynx.config.ts. You upload the file as-is; the release your
backend indexes by is the one the build injected and embedded, not something you
pick here:
If you only need the file on disk for a one-off, build with
DEBUG=rspeedyinstead; that keeps it underdist/.rspeedy/<entry>/without any plugin.
The runtime reports each chunk's release as debugmetadata:<key>, e.g.
debugmetadata:0a62b9f5435af49d34a238d276a986d1bb64b6d1. Strip the
debugmetadata: prefix and <key> is exactly an artifact's source-map key
inside debug-metadata.json (one key per chunk: main-thread.js,
background.js, ...). So your backend reads those keys out of the uploaded file
and indexes by them; at error time it strips the prefix and looks the file up.
You never assign a release yourself.
Model B: also point the bundle at your host
To make devtools / error-monitoring services fetch the file automatically
you must write the URLs into the template before it is encoded. That means
tapping LynxTemplatePlugin.beforeEncode, obtained via the exposure that DSL
plugins publish:
- Read the class with
api.useExposed(Symbol.for('LynxTemplatePlugin')). - Order your plugin
.after('lynx:debug-metadata'), otherwise yourbeforeEncoderuns before the default plugin emits the file and reads empty.
plugins/host-debug-metadata.ts
Wire it in with the base URL of wherever you serve the files:
The emitted Lynx bundle now carries two fields pointing at the host, and they
are shaped differently. sourceContent.config.debugMetadataUrl is the bare link
<baseUrl>/<key>/debug-metadata.json, which devtools or your own remap service
fetch whole. compilerOptions.templateDebugUrl points at the same file but with
a fetch query appended (?field=bytecode-debug-info&filename=<main-thread.js>).
The query on templateDebugUrl is deliberate: Lynx's built-in red-screen decode
reads this field, so when the main thread throws it pulls bytecode-debug-info
straight from that link and decodes the frame. Writing it into the template is
all it takes to reuse Lynx's built-in debugging; the red screen shows source
locations with nothing extra to wire up.
Each JS sourceMappingURL trailer is also rewritten to the same host. The key
in the URL and the key you upload under are the same, so the links always
resolve.
Remap at error time
When a production stack arrives, run the decode chain against the
stored file: use resolveField to pull the right
source-map / bytecode-debug-info (locate the file by release in Model A,
or follow the in-bundle debugMetadataUrl in Model B), or the
lynx-debug-info-remapping
skill for a main-thread function_id:pc backtrace.
Reading the DebugMetadata file
You can JSON.parse it and use it directly:
To resolve one field in code (the same dispatch the dev server uses):
The schema grows alongside the emitter. Consumers should ignore fields they don't recognize rather than rejecting the payload.
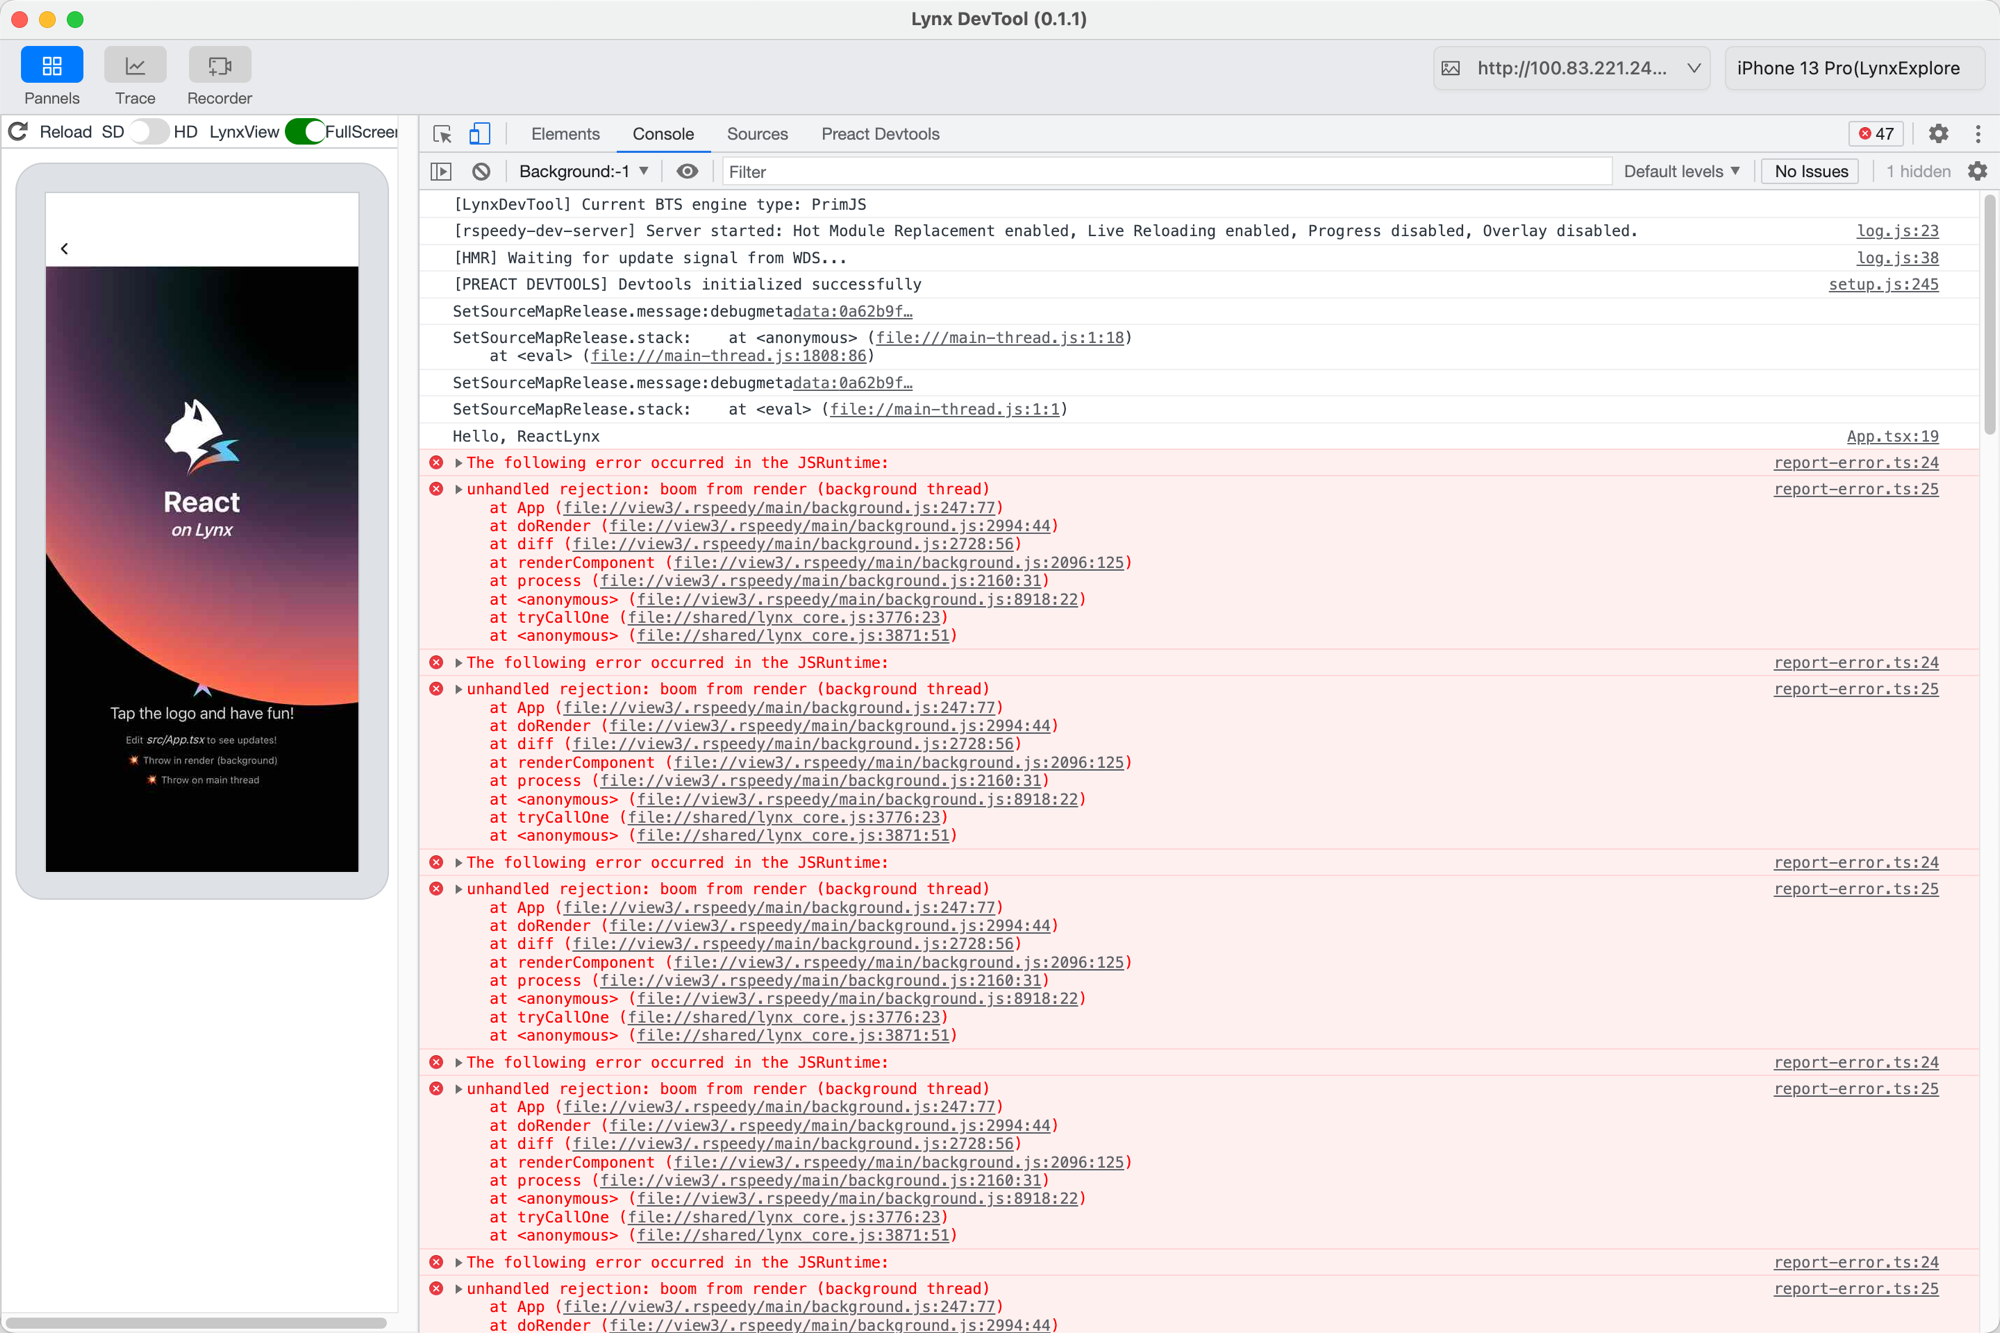
Walkthrough: map a real error
To see both paths end to end, examples/react's App.tsx throws in two
places: once during render (background thread) and once in a main-thread tap
handler:
Build and run it, then trigger each error. Below, metadata is this build's
debug-metadata.json parsed with JSON.parse (fetched from your store by
release, Model A).
Background error: one step
Tapping Throw in render throws on the background thread. The console frame
points into background.js:
background.js:247:77 is a real (line, column), so a single source-map step
maps it back:
background.js:247:77 maps to src/App.tsx:14, the if (crashRender) line; the
real throw is on line 15. Being one line off is source-map imprecision: the
bundle collapses if (crashRender) { throw ... } onto a single line and only
records a mapping for the start of that statement, so the decode lands on the
outer if. The production red screen decodes to the same line, which is close
enough to find the bug.
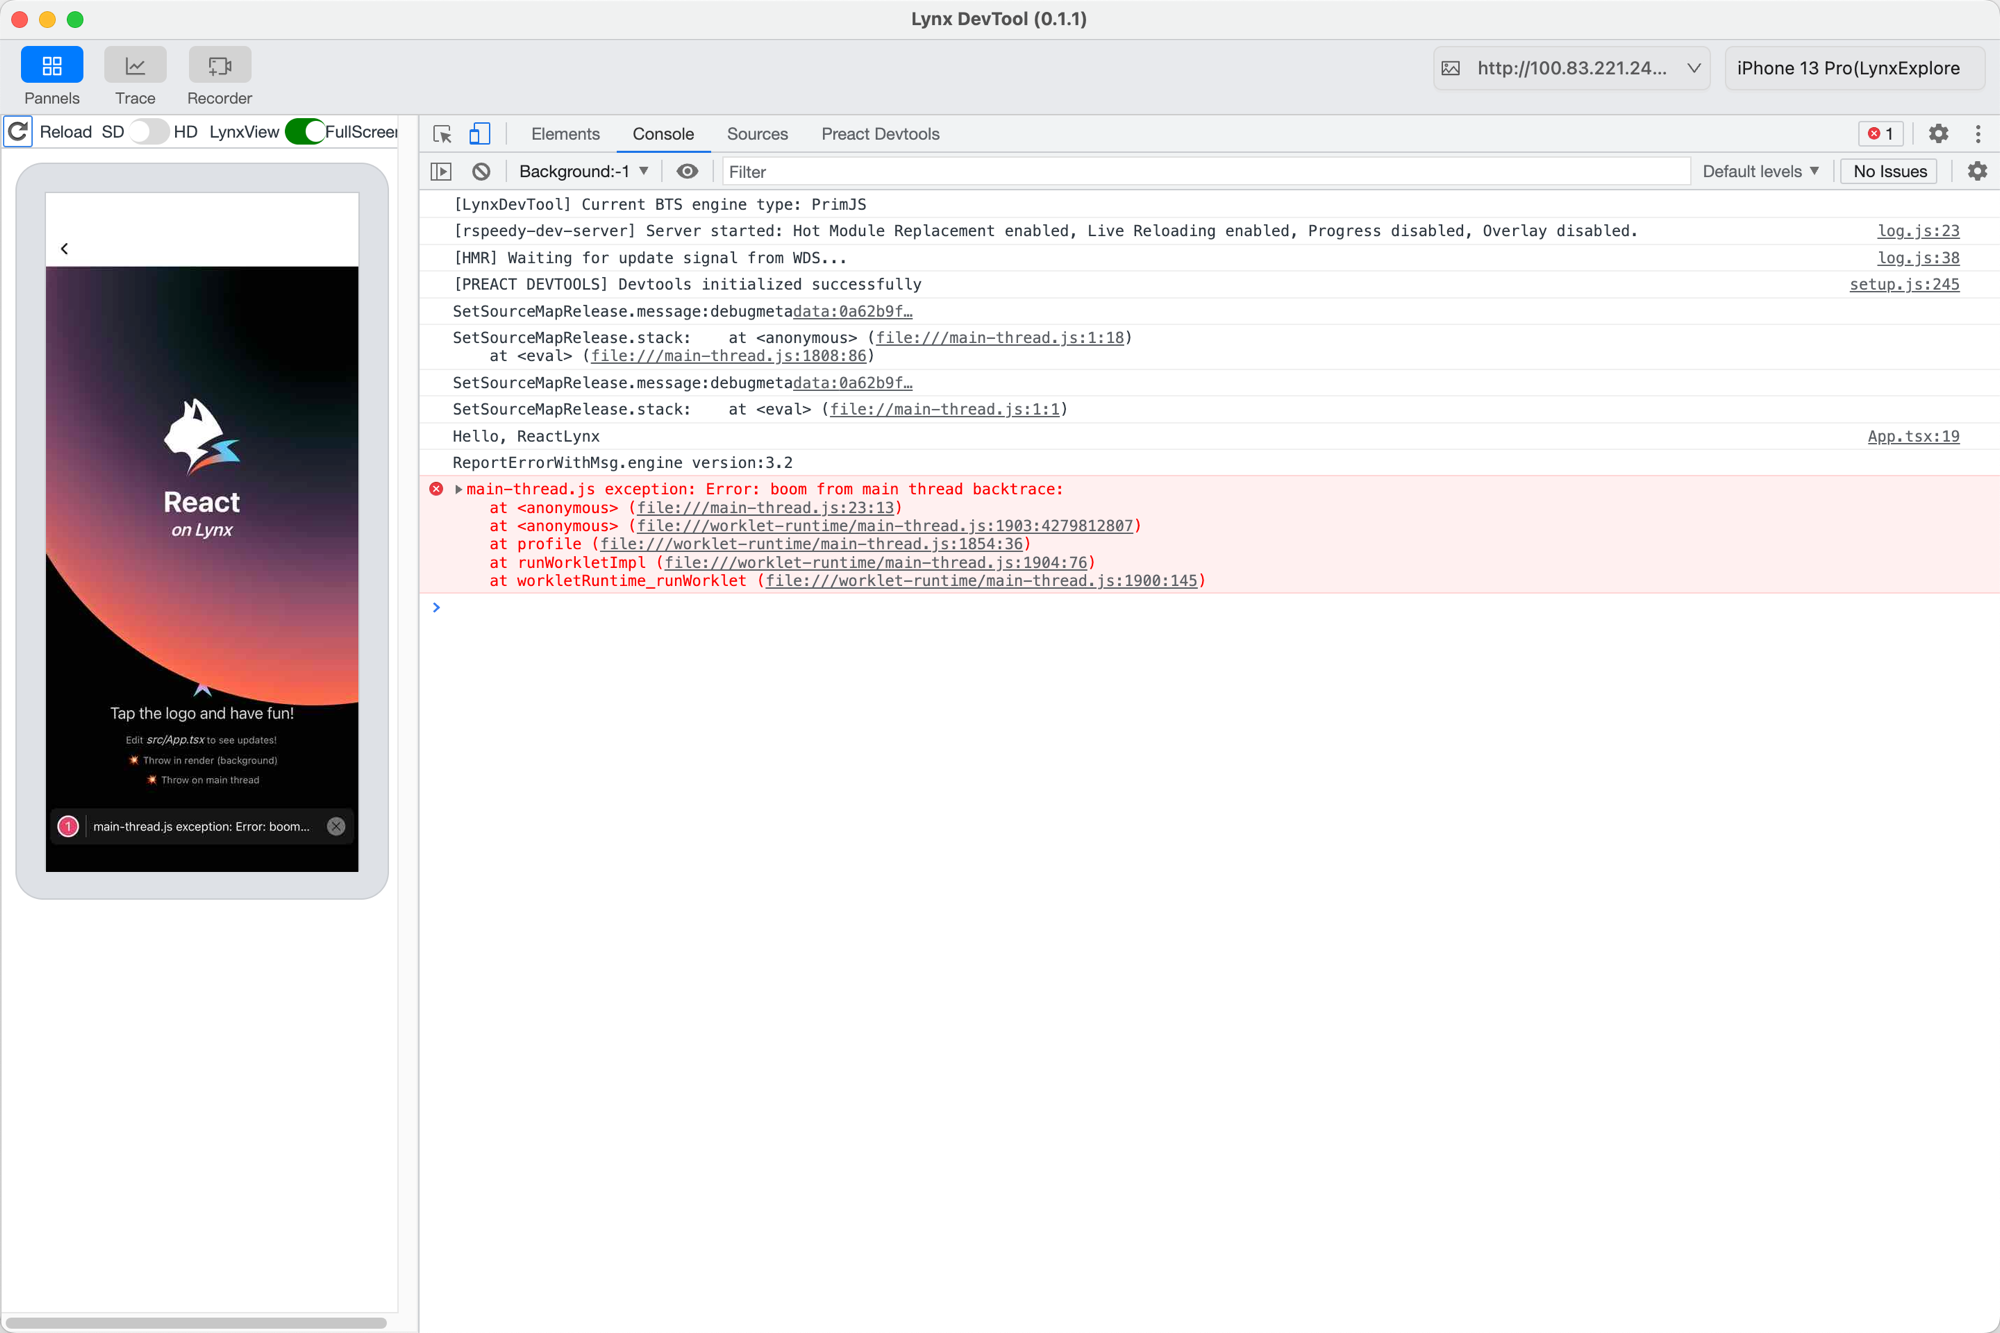
Main-thread error: two steps
Tapping Throw on main thread throws on the main thread. In the console:
The report sent to your monitoring is the JSON from the top of this page; the
frame that matters carries a release:
First, find the DebugMetadata by release. Strip the debugmetadata: prefix;
the rest, 0a62b9f..., is a chunk's source-map key, so fetch that build's
file from your store by it:
Then map the frame. 23:13 is function_id 23, pc 13 (not a line:column), in
two steps:
main-thread.js:23:13 maps to src/App.tsx:65, the main-thread throw. The
lynx-debug-info-remapping
skill runs this whole chain for you.