Trace UI Basic Usage Guide
This guide introduces the main UI structure and common operations to help you quickly get started with performance analysis.
UI Structure Overview
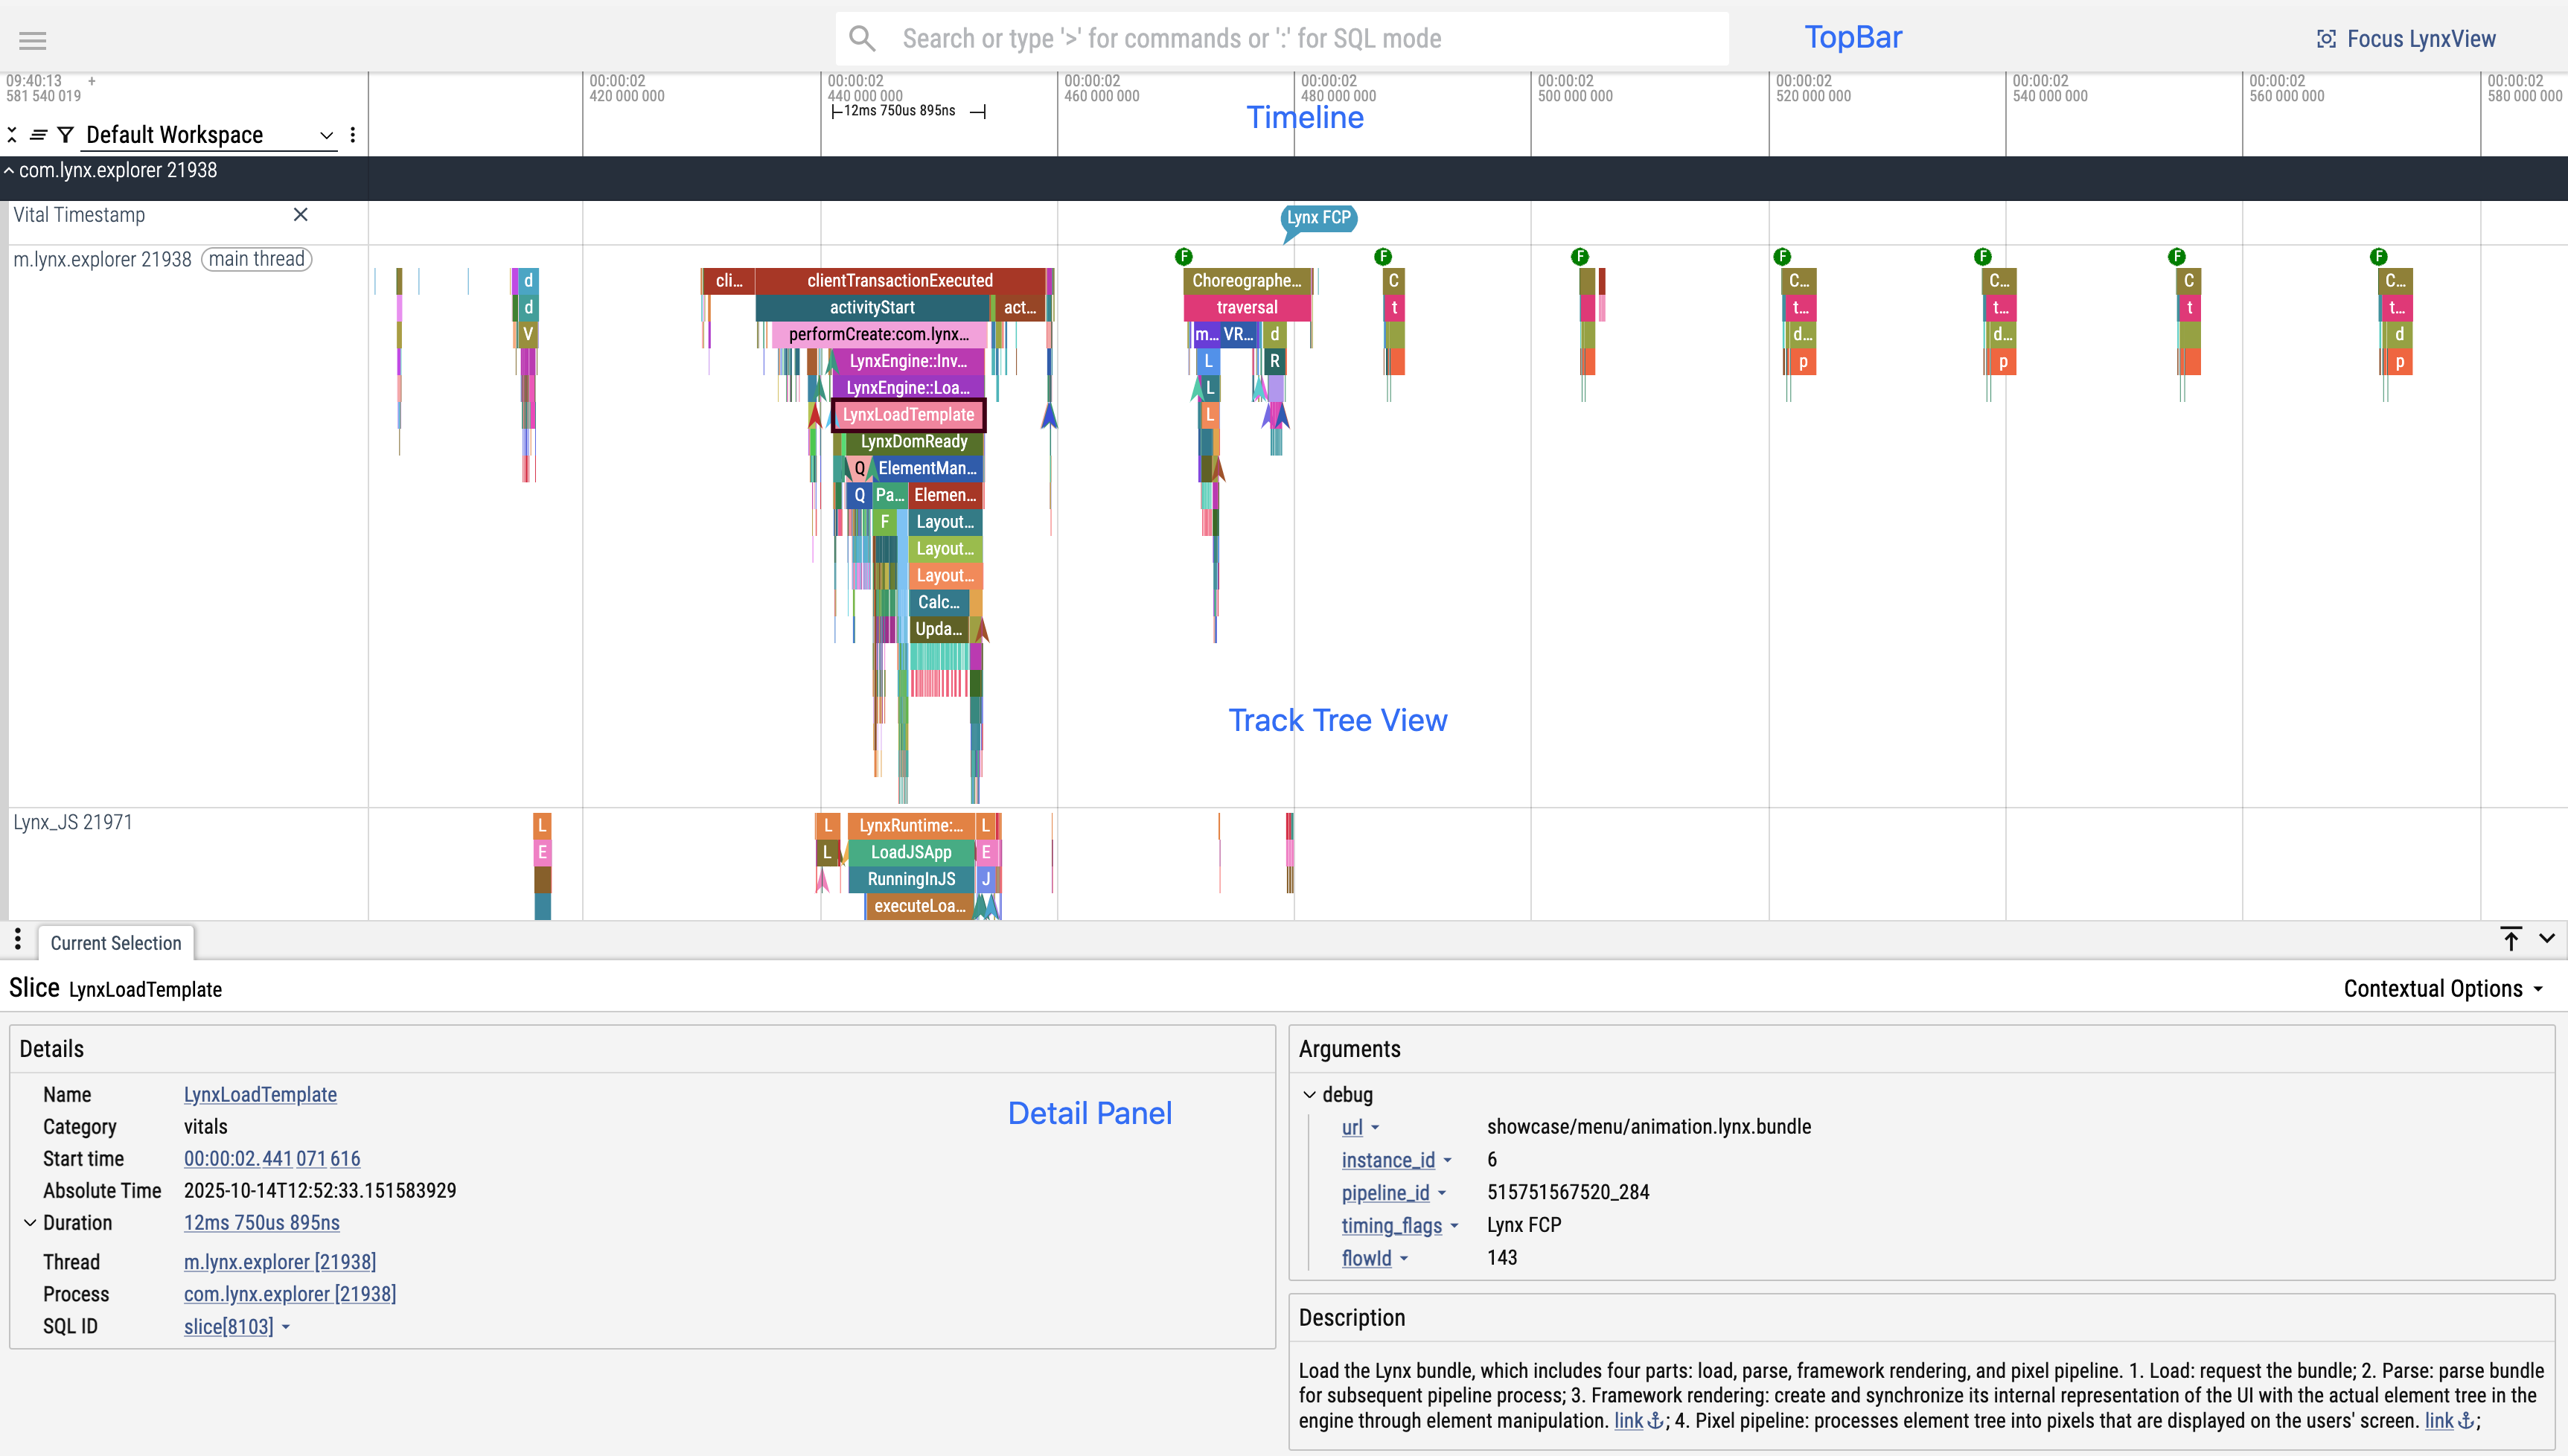
The Trace UI consists of the following key components:
- Topbar: Includes a search box, SourceMap Decode, Focus LynxView, and other features.
- Timeline: Displays the occurrence and duration of TraceEvents. Supports adding annotations (notes), measuring intervals, and more.
- TrackTreeView: Organizes TraceEvents by track (typically one or more per thread), making it easy to distinguish between different threads/tasks.
- DetailPanel: Shows detailed information about a selected TraceEvent, including parameters, duration, thread, process, and more.
Common Operations
Open a Trace File
- Drag and drop a trace file directly onto the page for automatic parsing and display of trace.
Zoom and Pan the Timeline
- Zoom in/out: Use the
w(zoom in) ands(zoom out) keys. - Pan left/right: Use the
a(left) andd(right) keys.
Search for TraceEvents
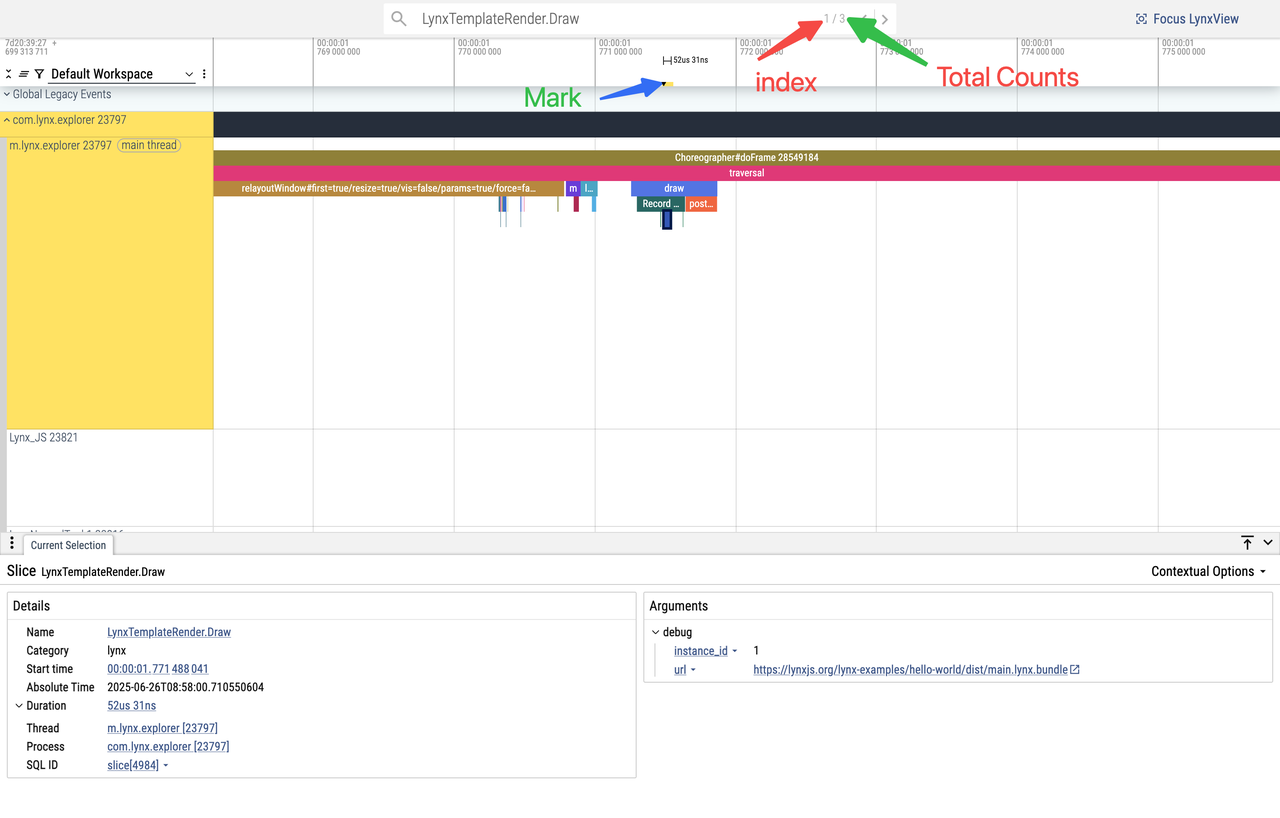
- Enter TraceEvent names, parameters, or keywords in the Topbar search box to quickly locate events.
- Press the
fkey to jump to the currently selected search result. - Click the arrow at the end of the search box to jump to the previous/next result, or press Enter to move to the next result.
- The Timeline will highlight the currently selected search result for easy identification.
View TraceEvent Details
- Click any TraceEvent in the Timeline to view its detailed parameters, duration, process, and thread information in the DetailPanel.
Aggregate TraceEvents
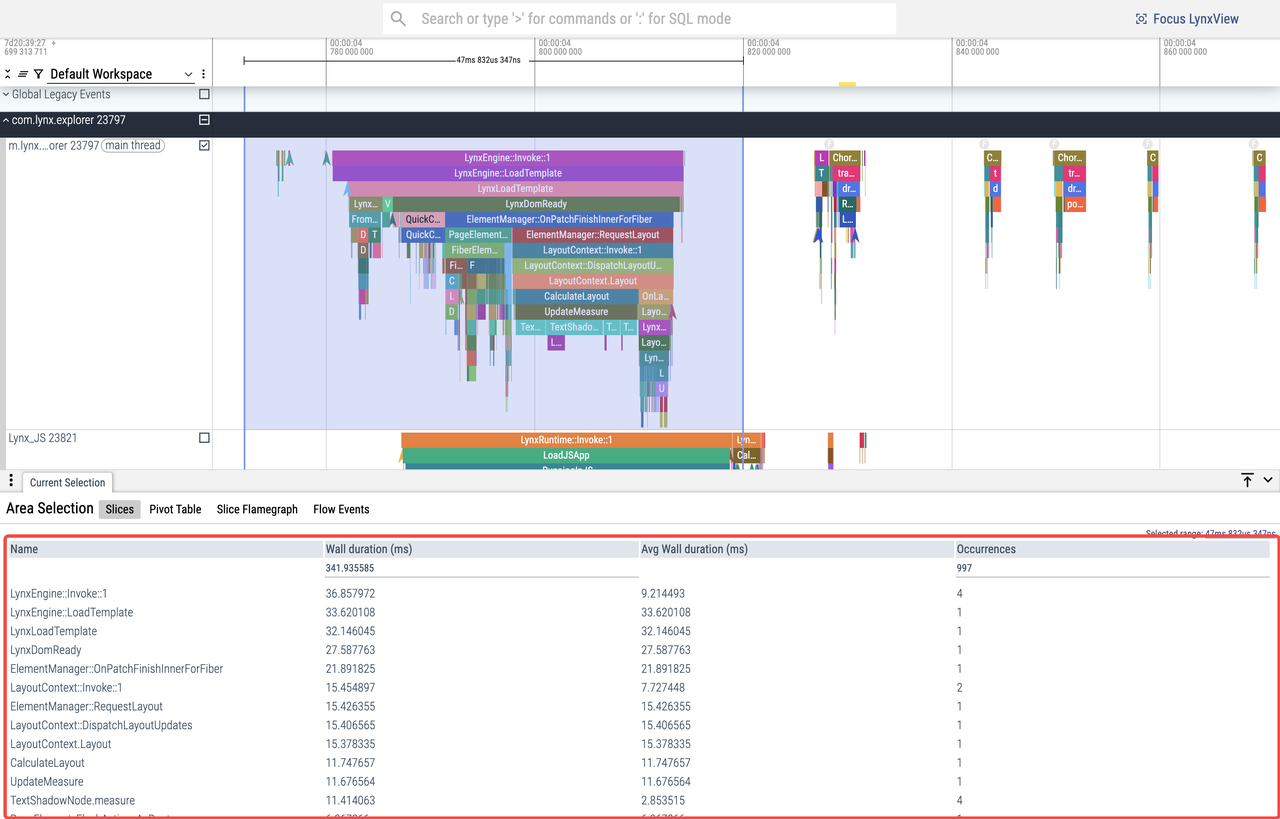
- Select a range of TraceEvents by dragging with the left mouse button across one or more tracks. Events will be aggregated by name.
- Aggregated results are shown in the DetailPanel, including total duration, average duration, and occurrence count.
- Click the column headers in the aggregation results to sort by name, total duration, average duration, or count.
Add Timeline Annotations
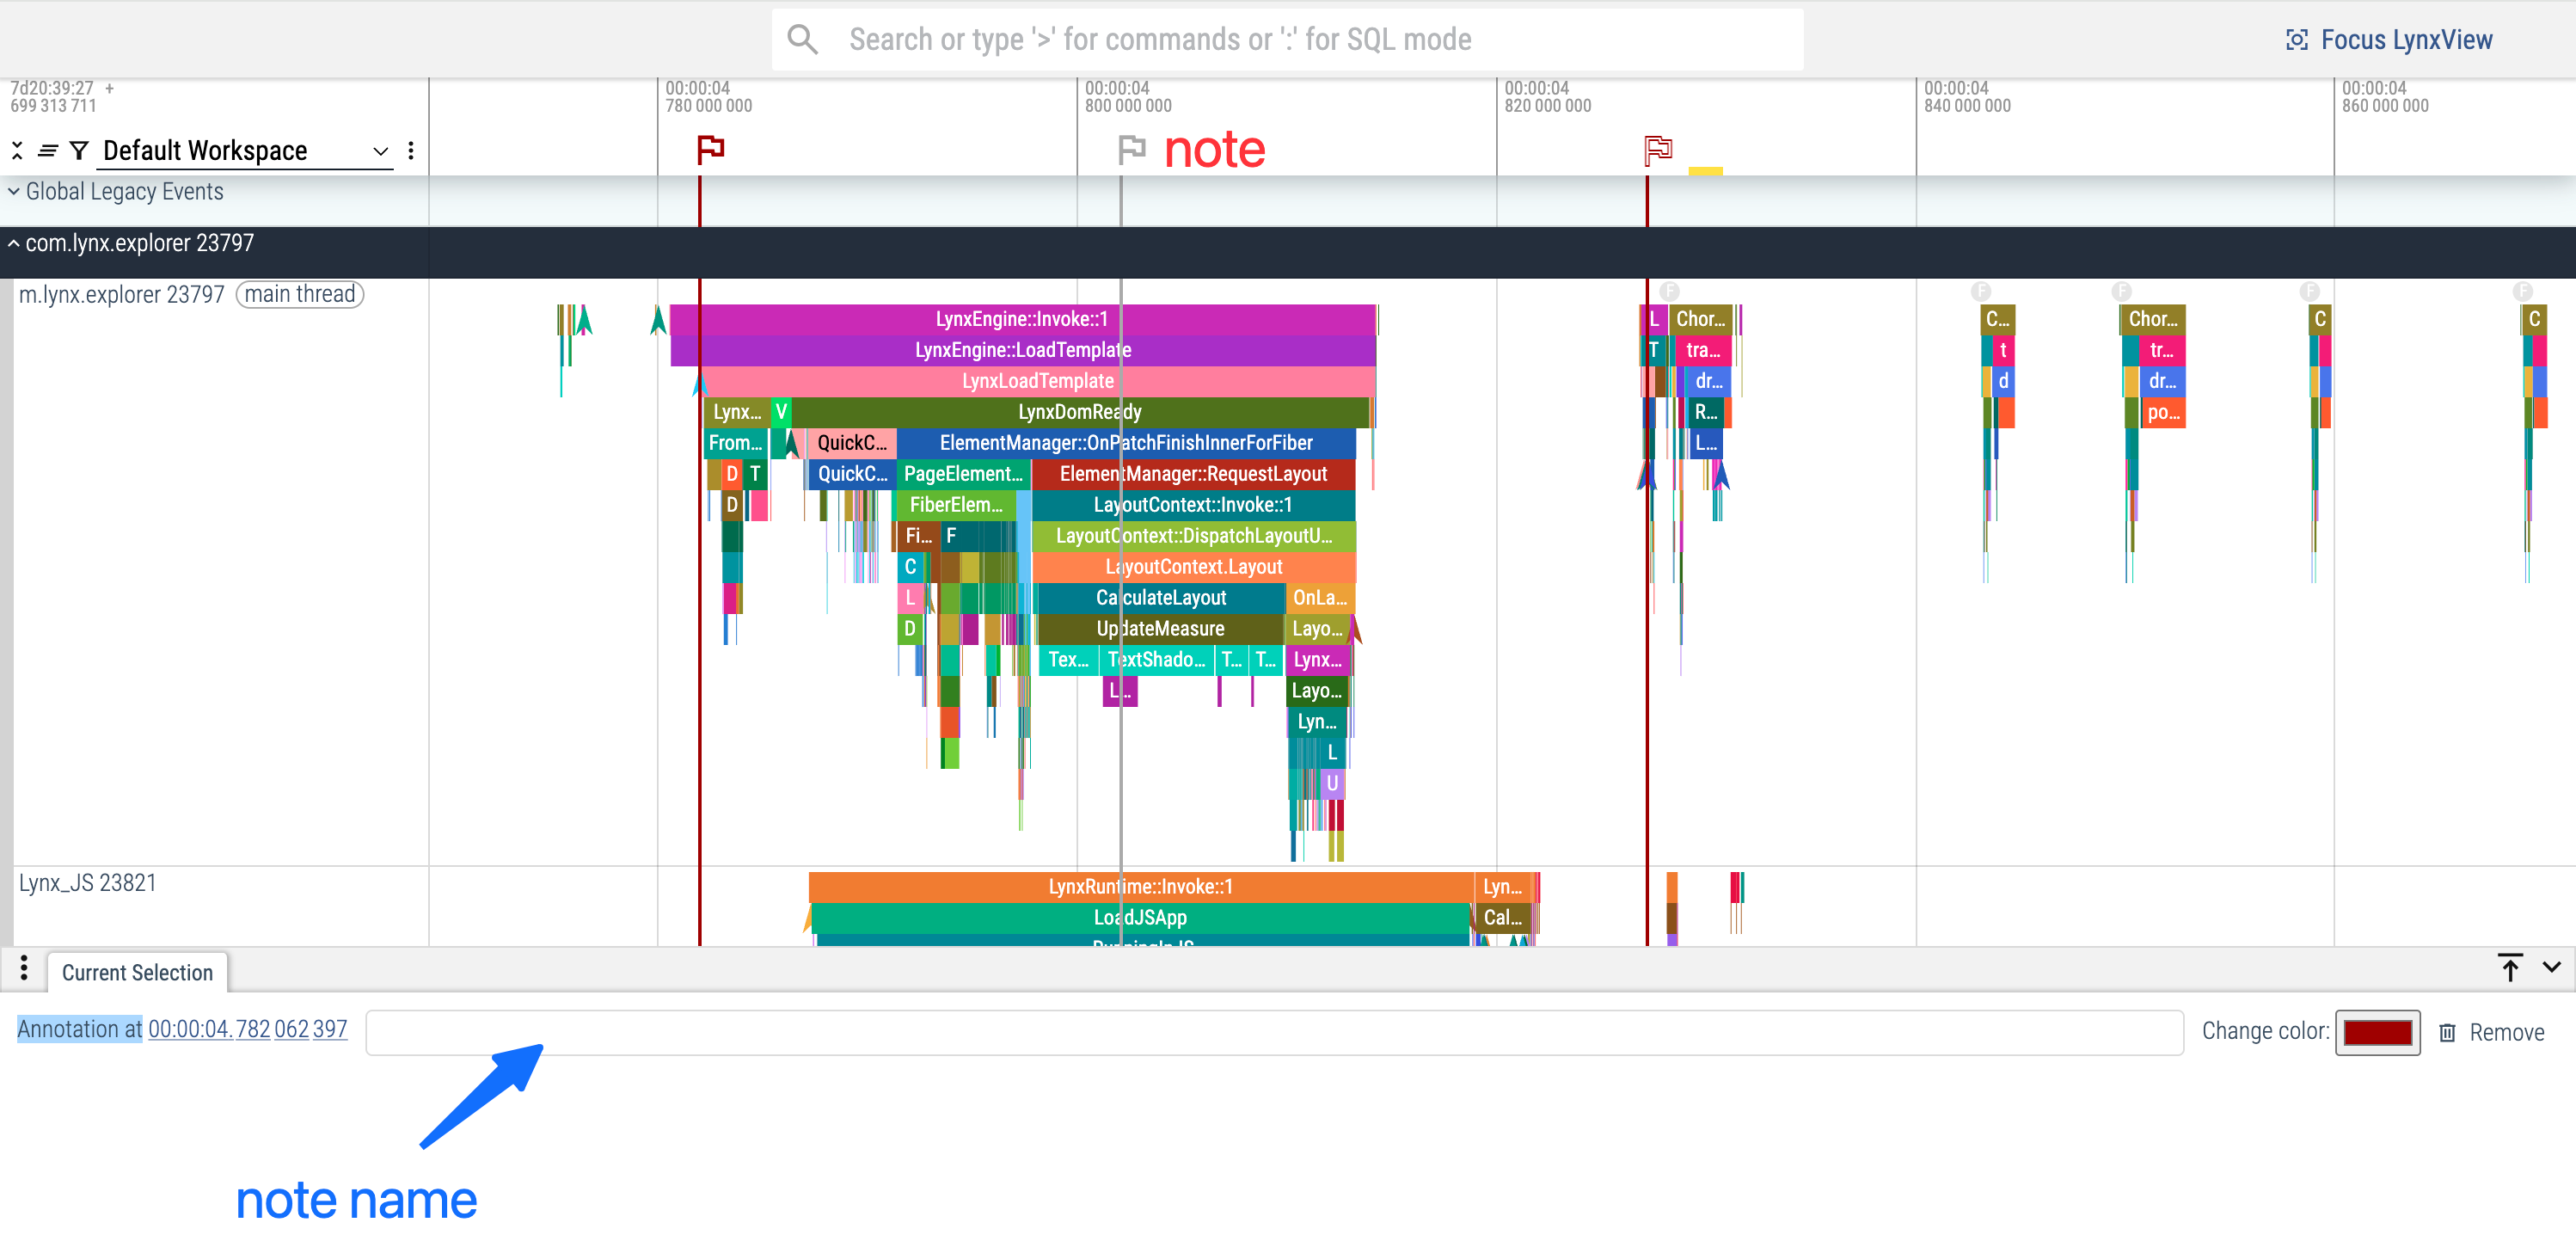
- Click on the Timeline to add a note at the corresponding position. Notes can be named for easier identification and navigation.
Measure Time Intervals
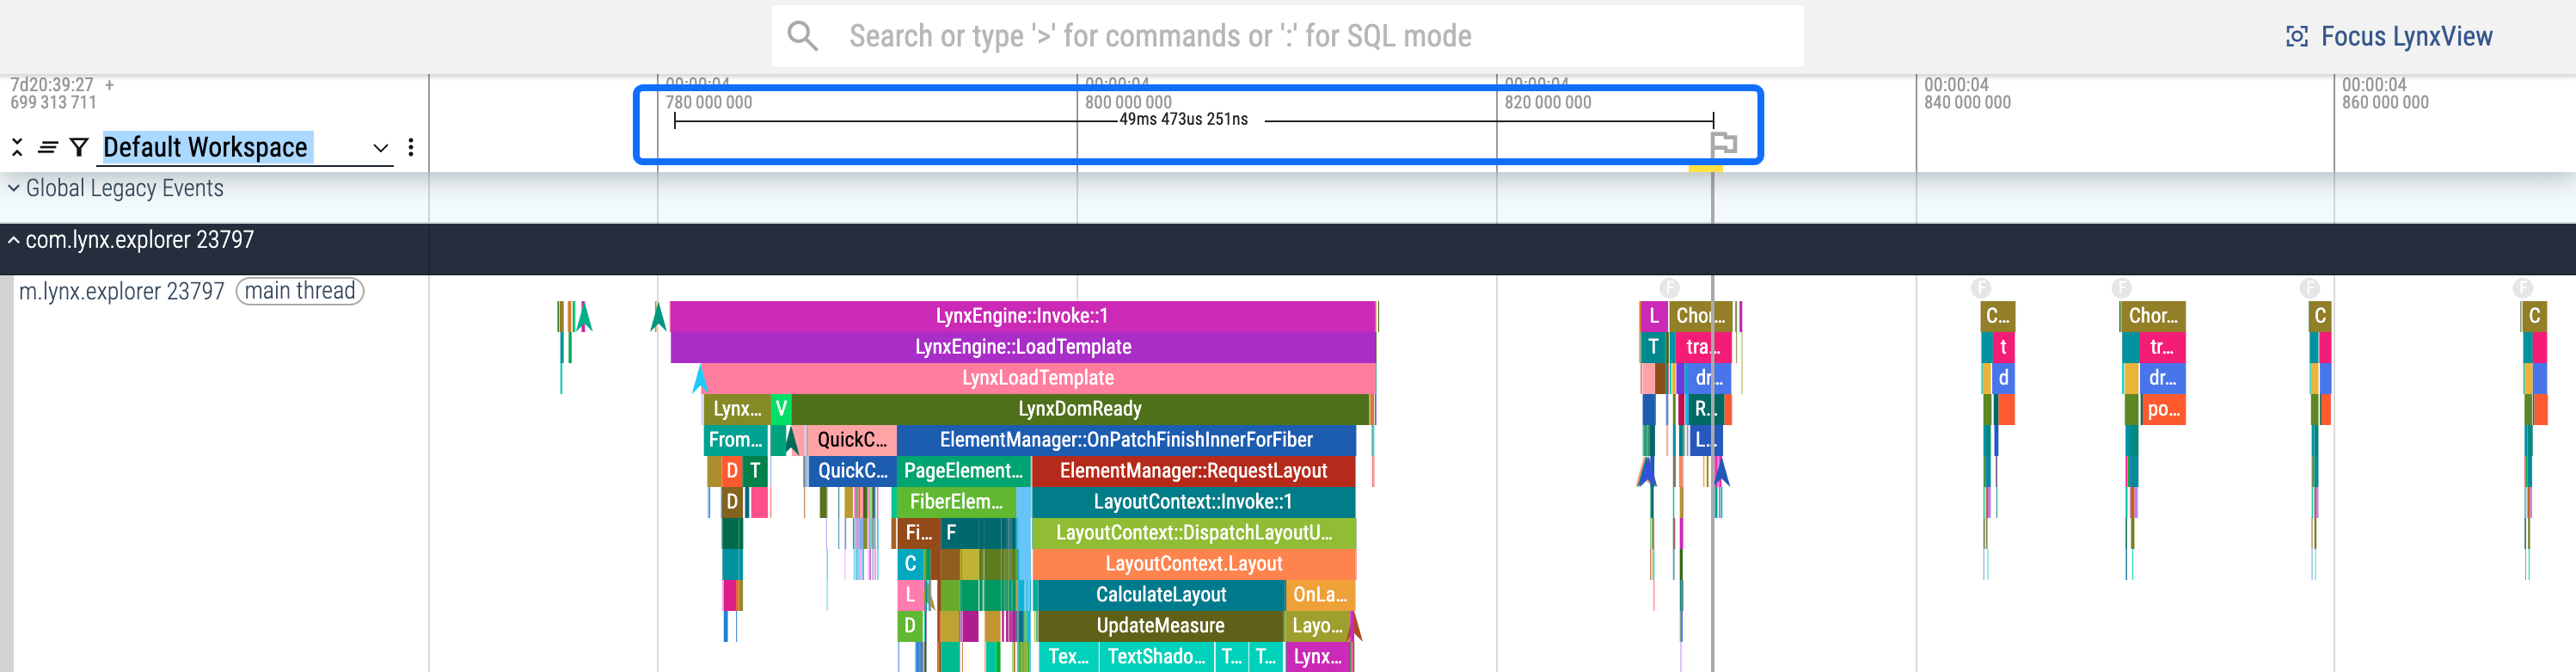
- Click and drag on the Timeline to measure the interval between two points. This is useful for precisely analyzing the duration of tasks or operations.
Focusing LynxView
Trace data may contain events from multiple Lynx pages. Trace supports focusing on one or more specific Lynx pages, making it easier to locate and analyze performance issues for particular pages.
1. Click Focus LynxView button

2. Select the Lynx page(s) by URL
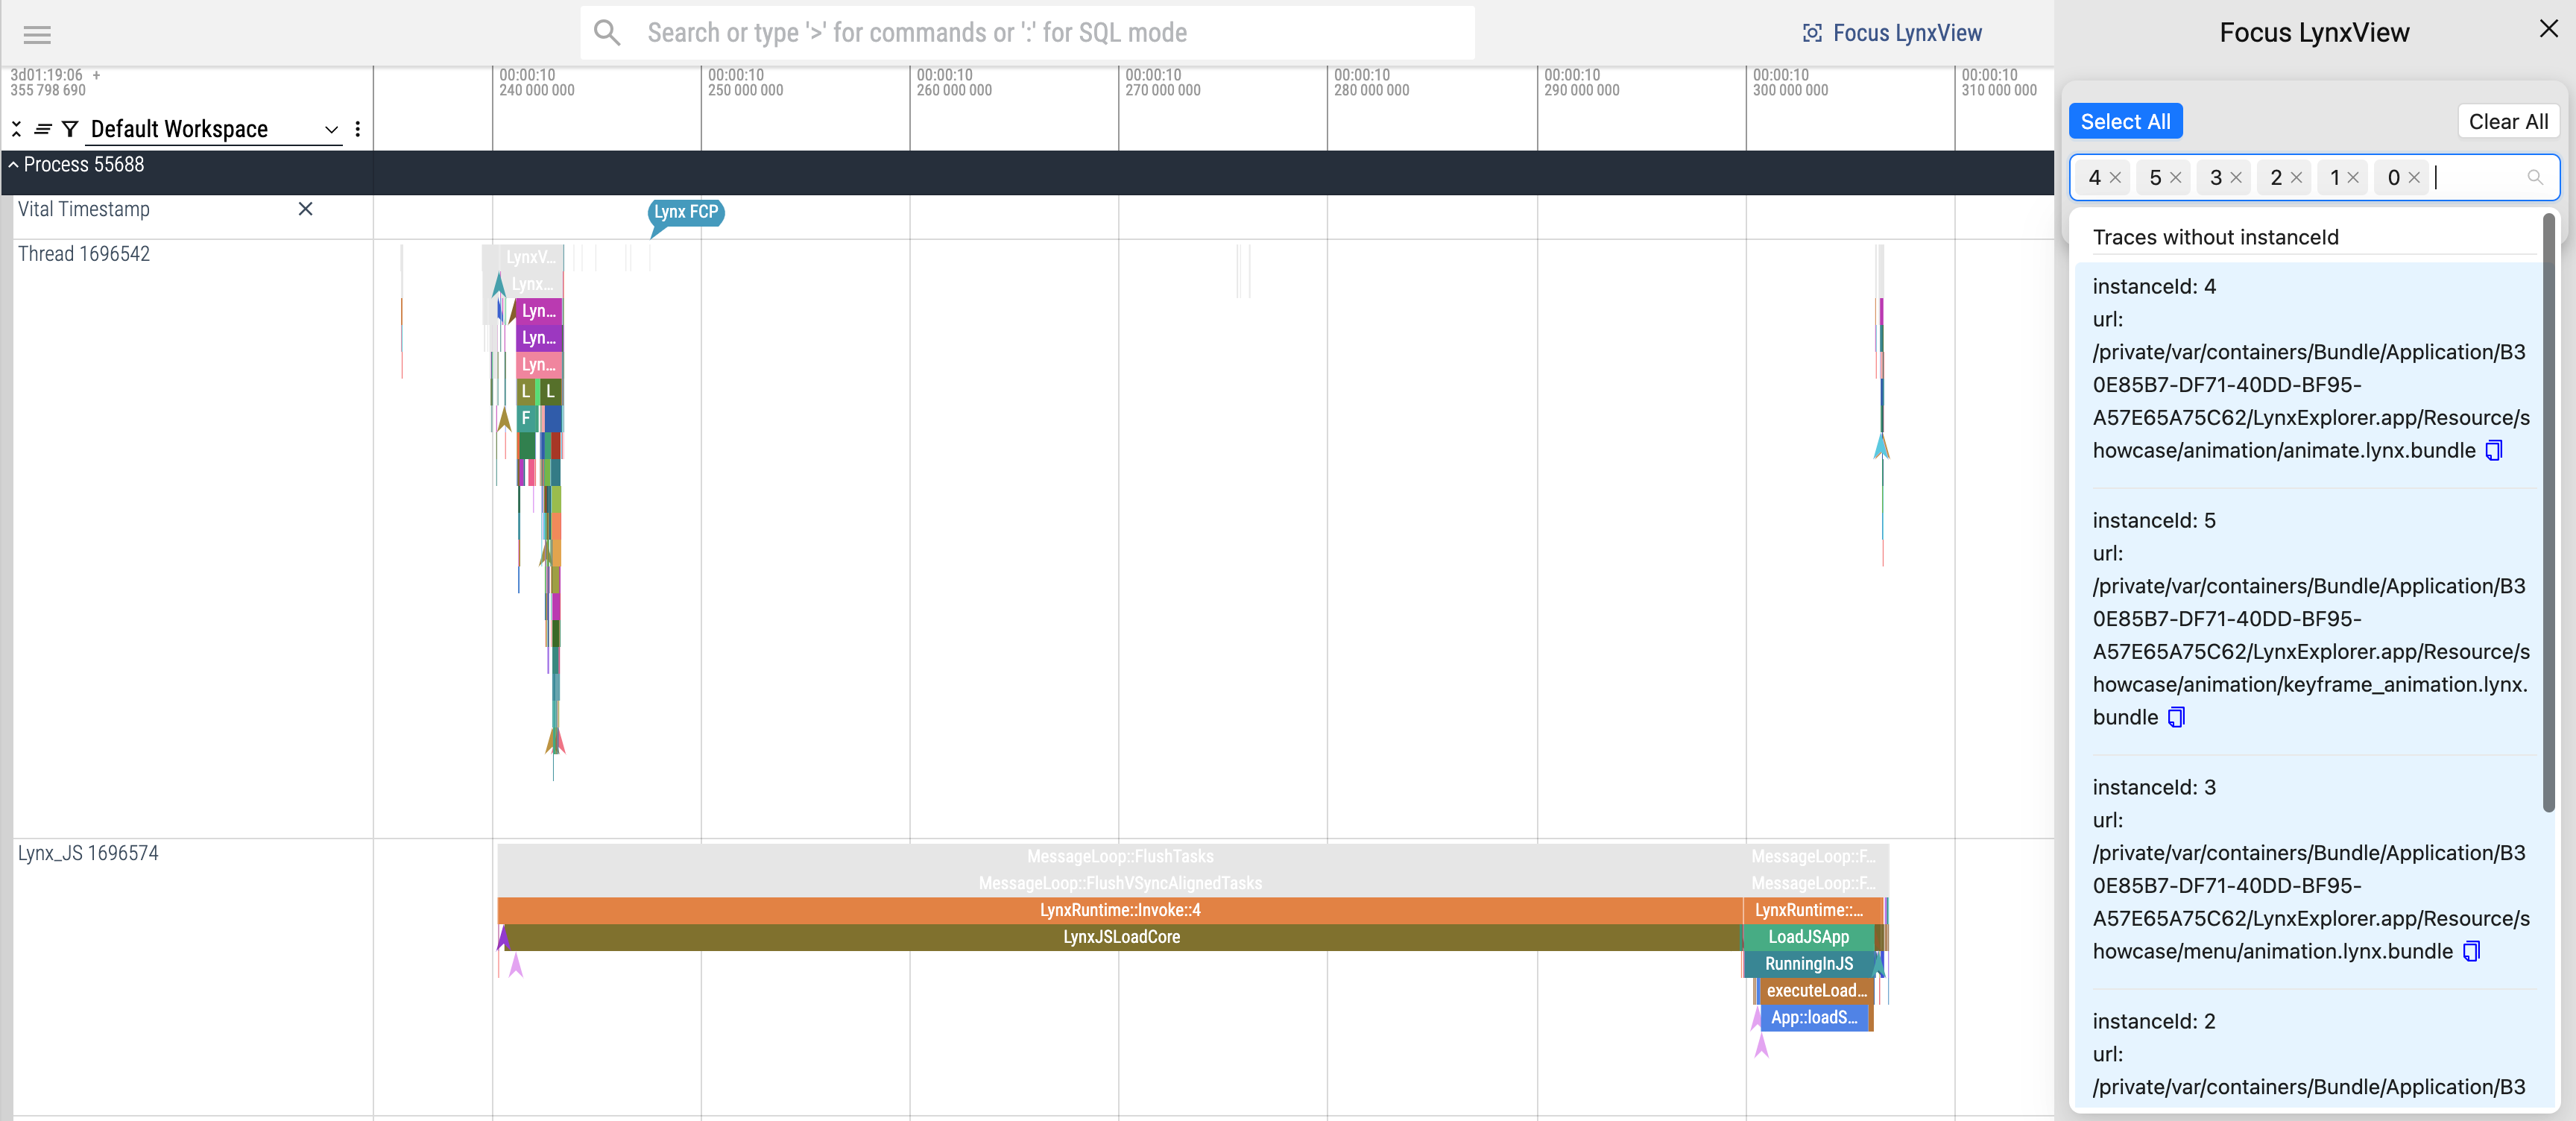
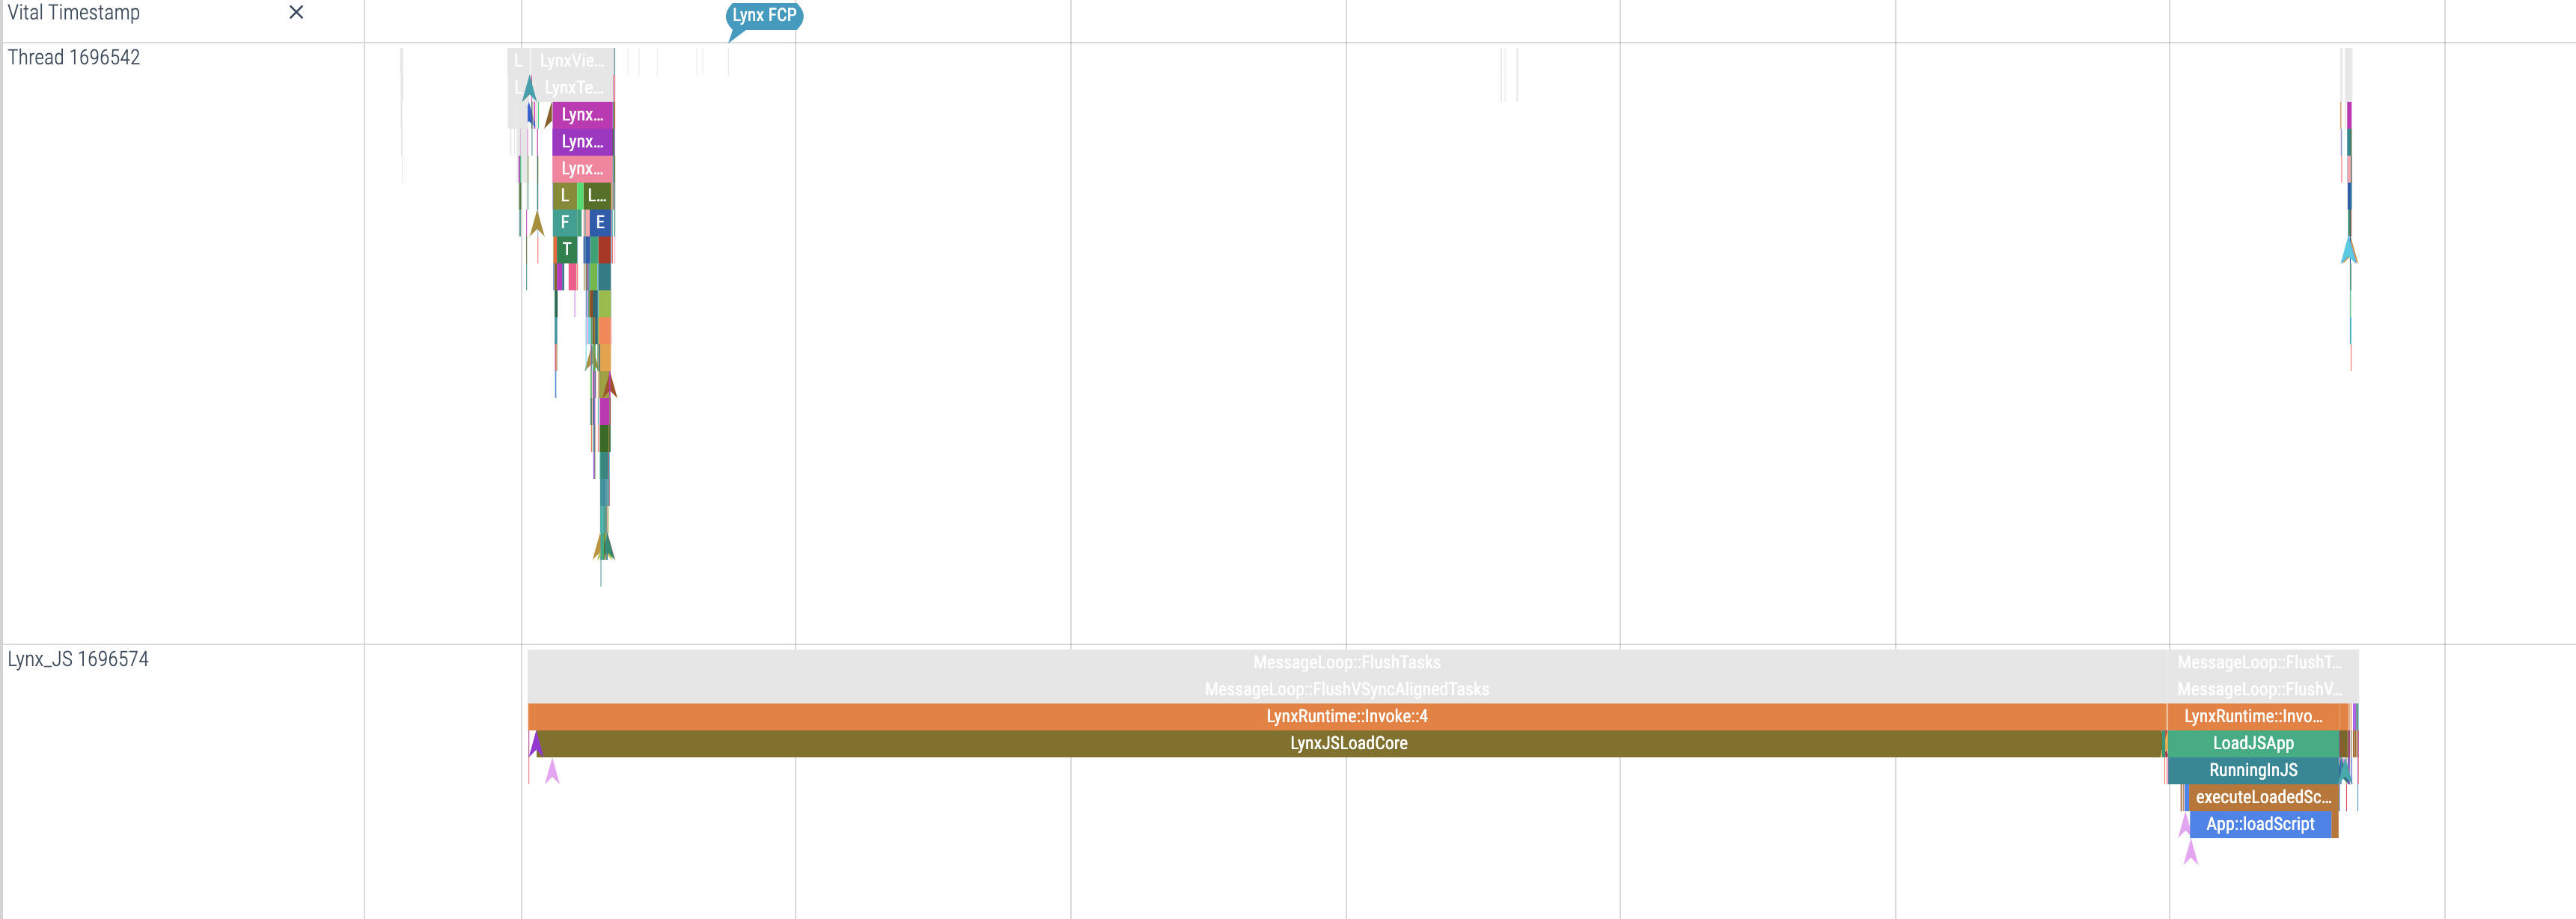
After selecting the Lynx page(s), Trace events from unselected pages will be grayed out.
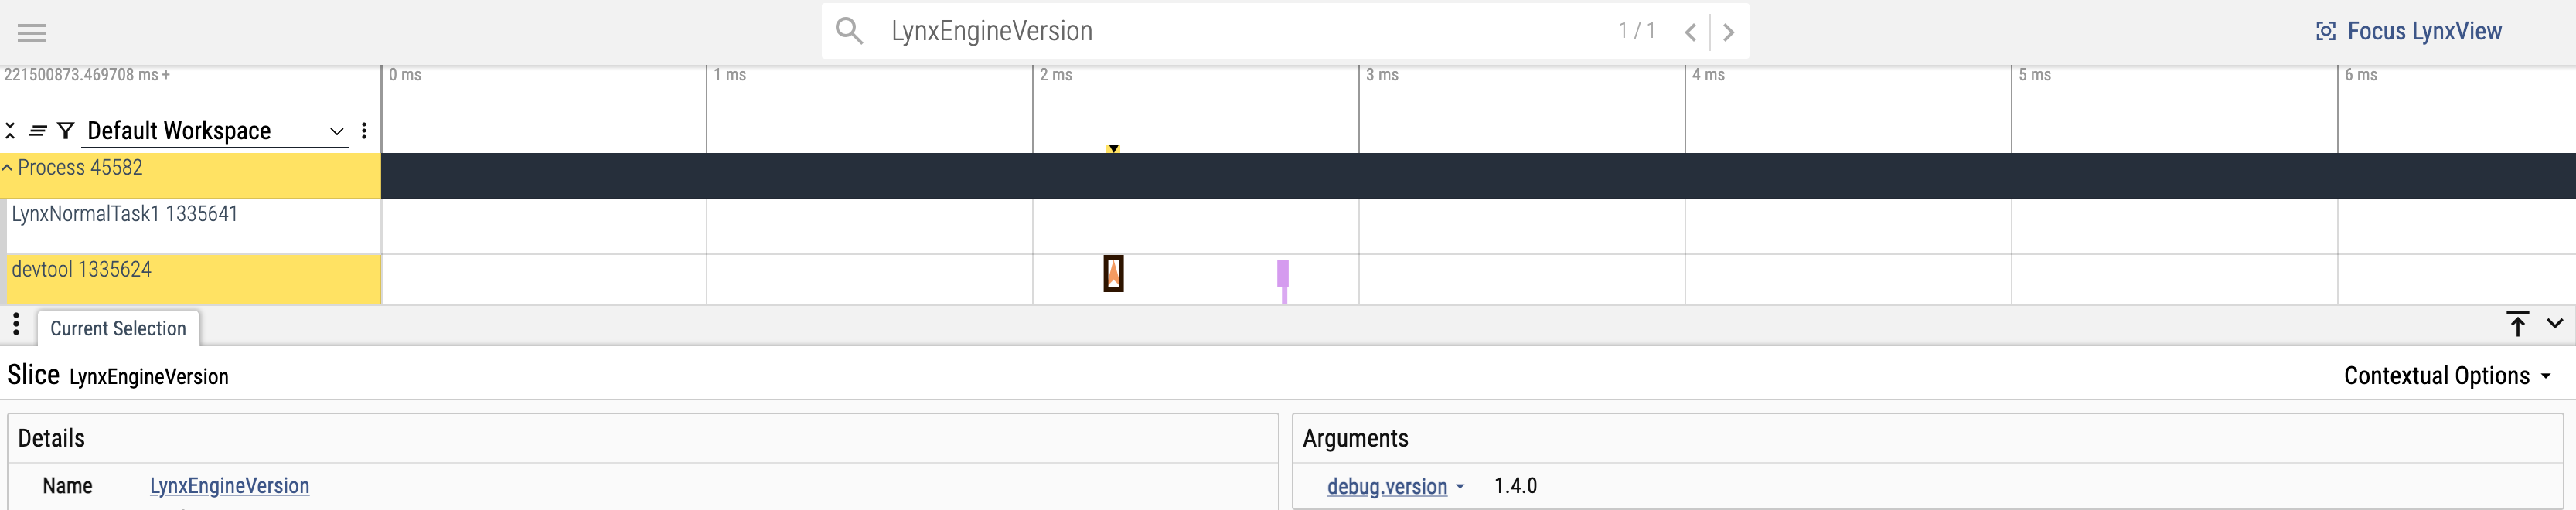
Querying Lynx Engine Version
Search for LynxEngineVersion or Version to find the Lynx Engine version.
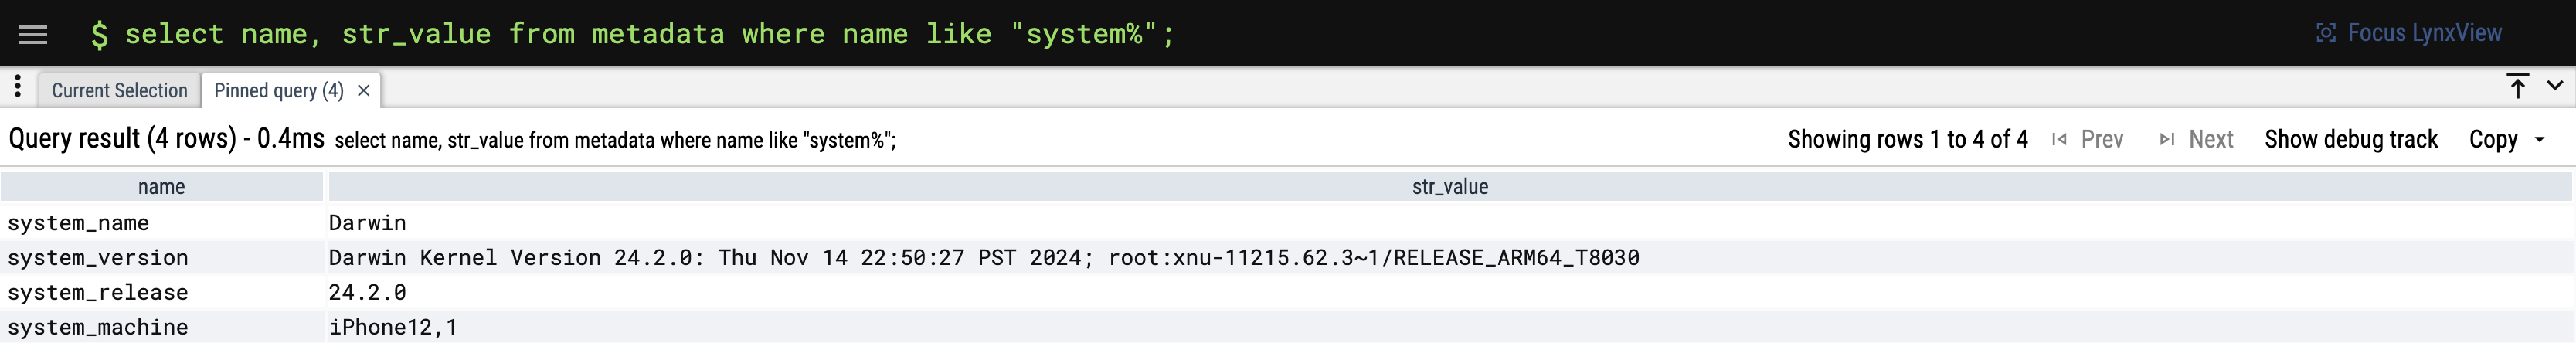
Querying the System Where the Trace Was Recorded
- Enter a colon in the Topbar search box to enter SQL query mode;
- Input the following SQL statement to query the system information where the Trace was recorded:
Additional Resources
For a more detailed guide on using the Trace UI and its advanced features, please refer to the official Perfetto documentation: perfetto-ui