

Panels
Choose Page and Debugging Options

There may be multiple Lynx page instances at the same time in a page. For debugging between different page instances, you need to select the current page instance to be debugged.
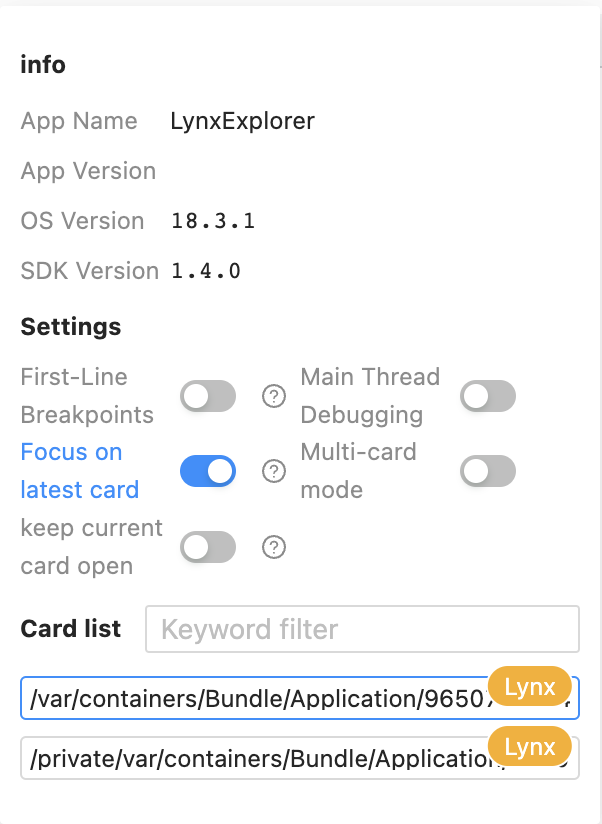
At the bottom of the debugging options page, you can select the page to be debugged. Move the mouse over the page path, and the page thumbnail will be displayed on the right.
In the debugging options menu, there are App Info for displaying application and Lynx information, and Settings for setting debugging options.
Debugging Panels
Dive into the debugging functions.
Elements
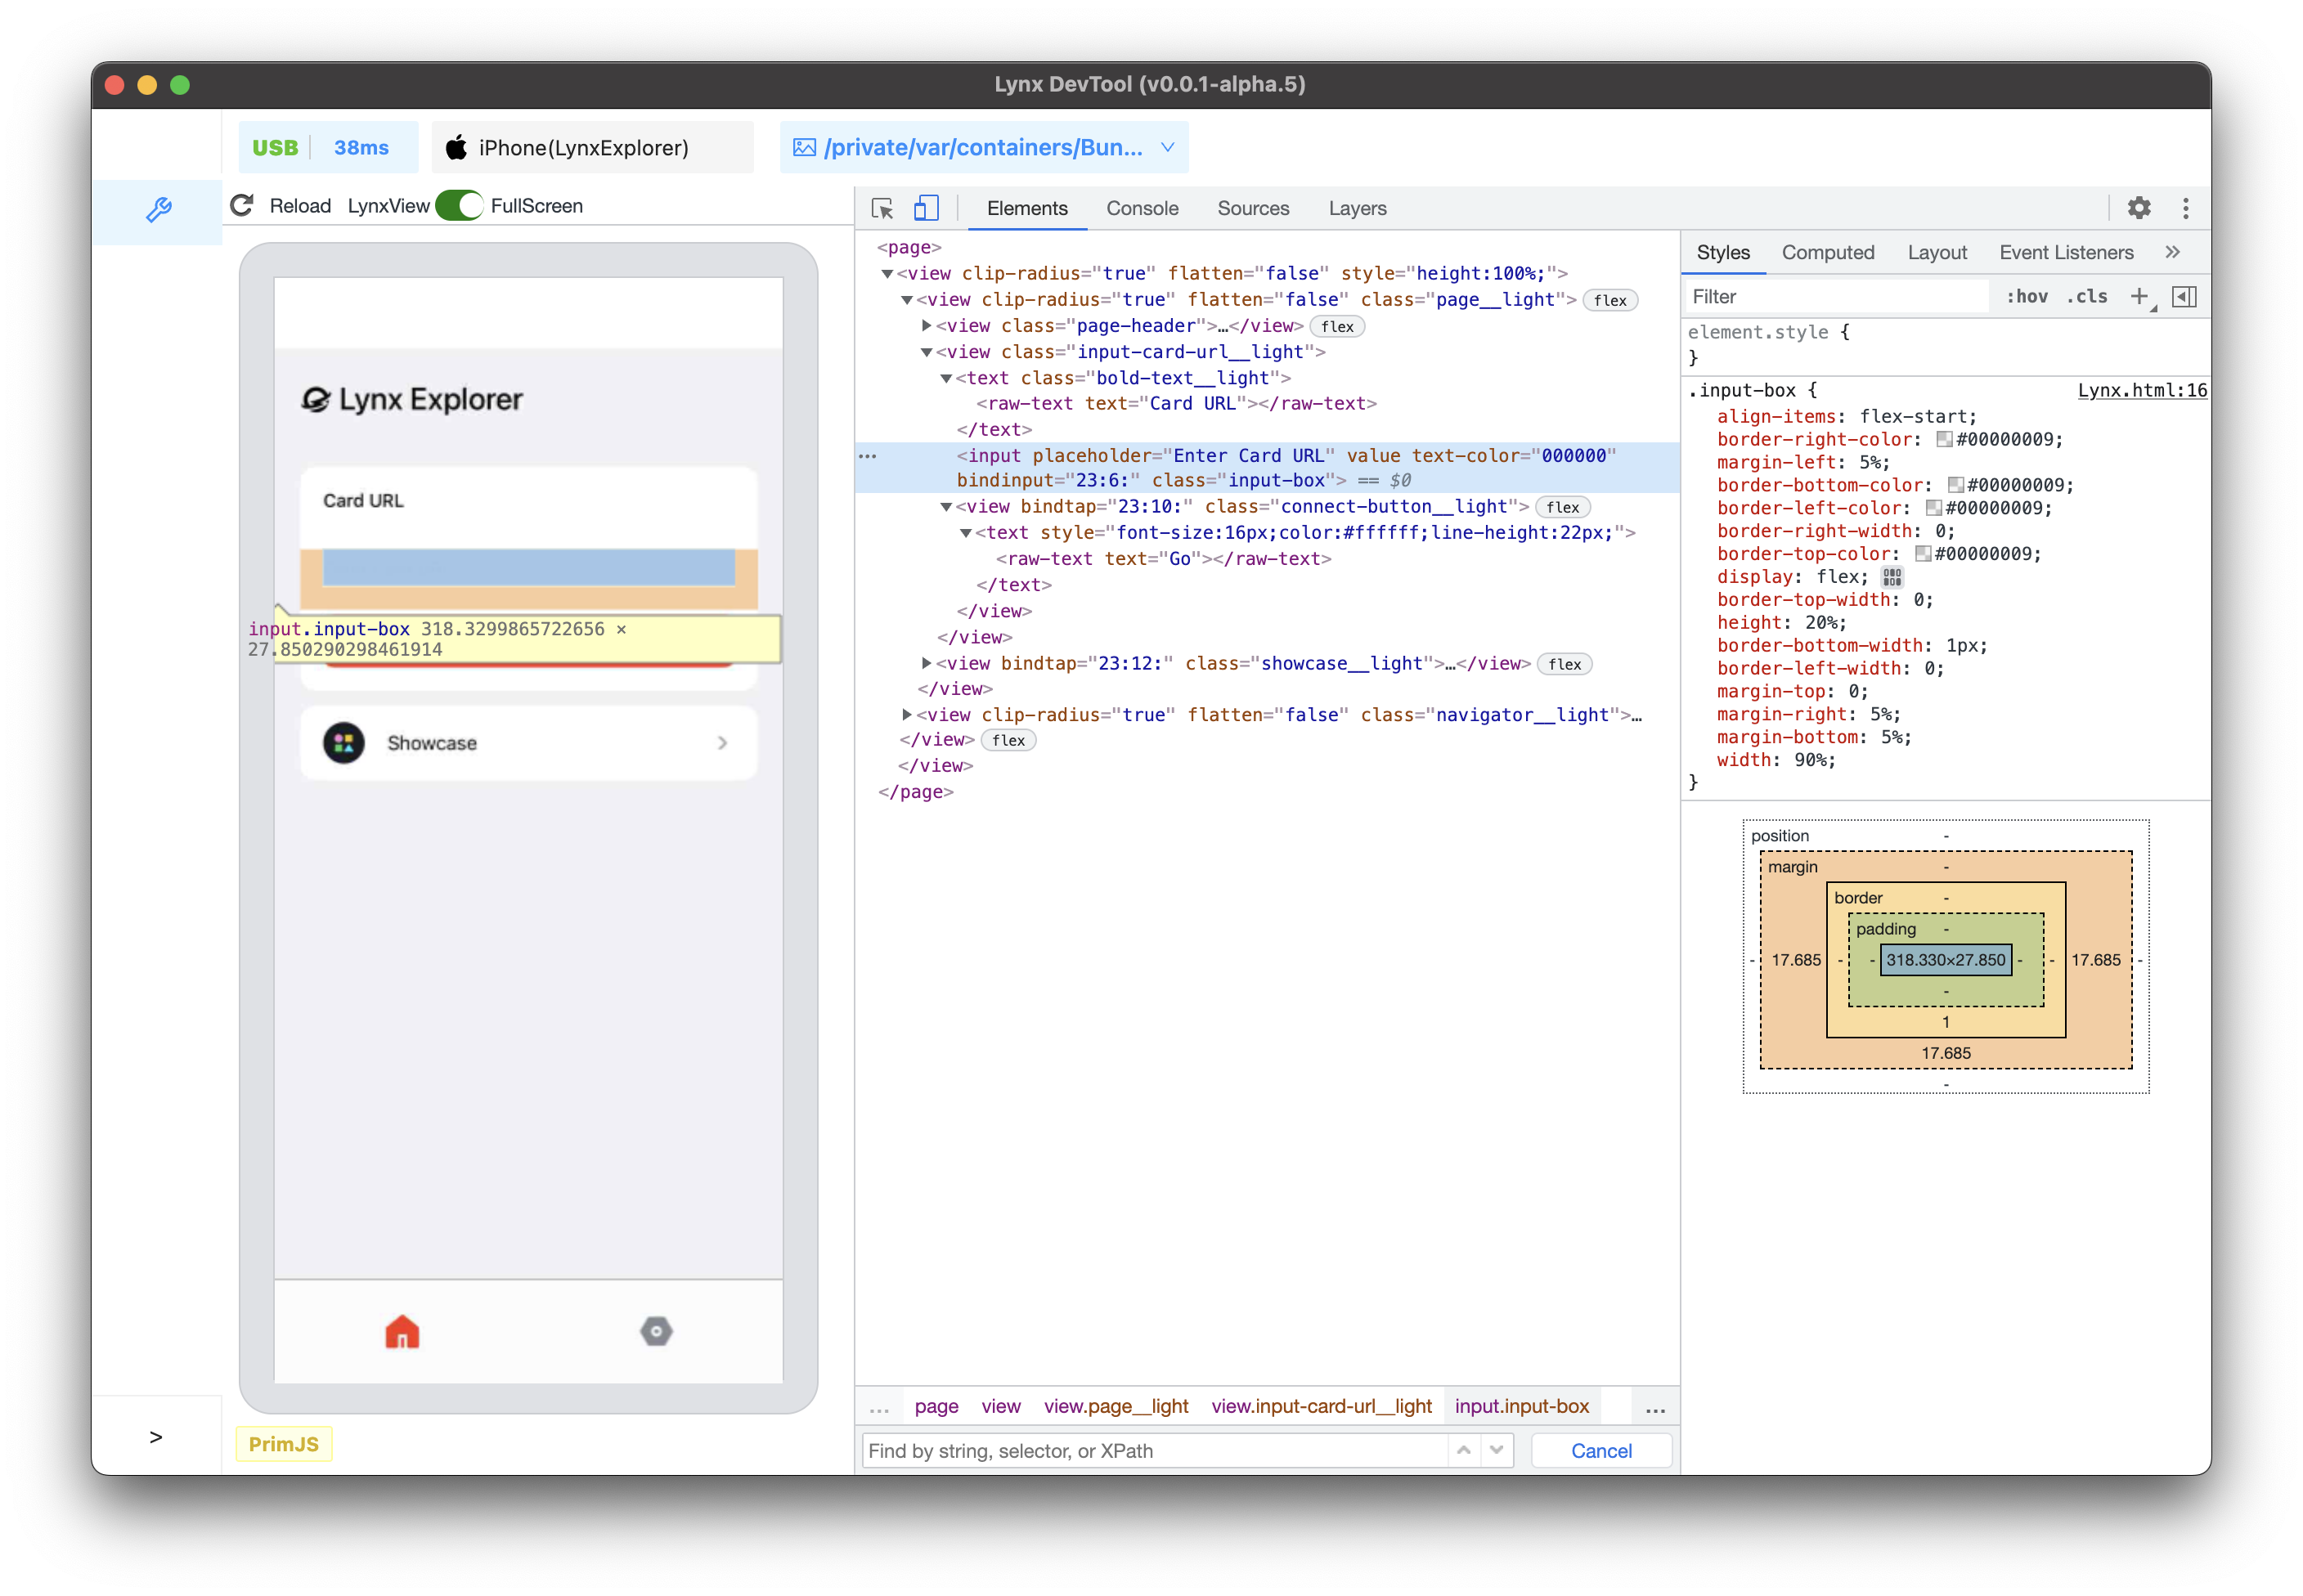
The Elements panel allows you to inspect and modify elements.
Console
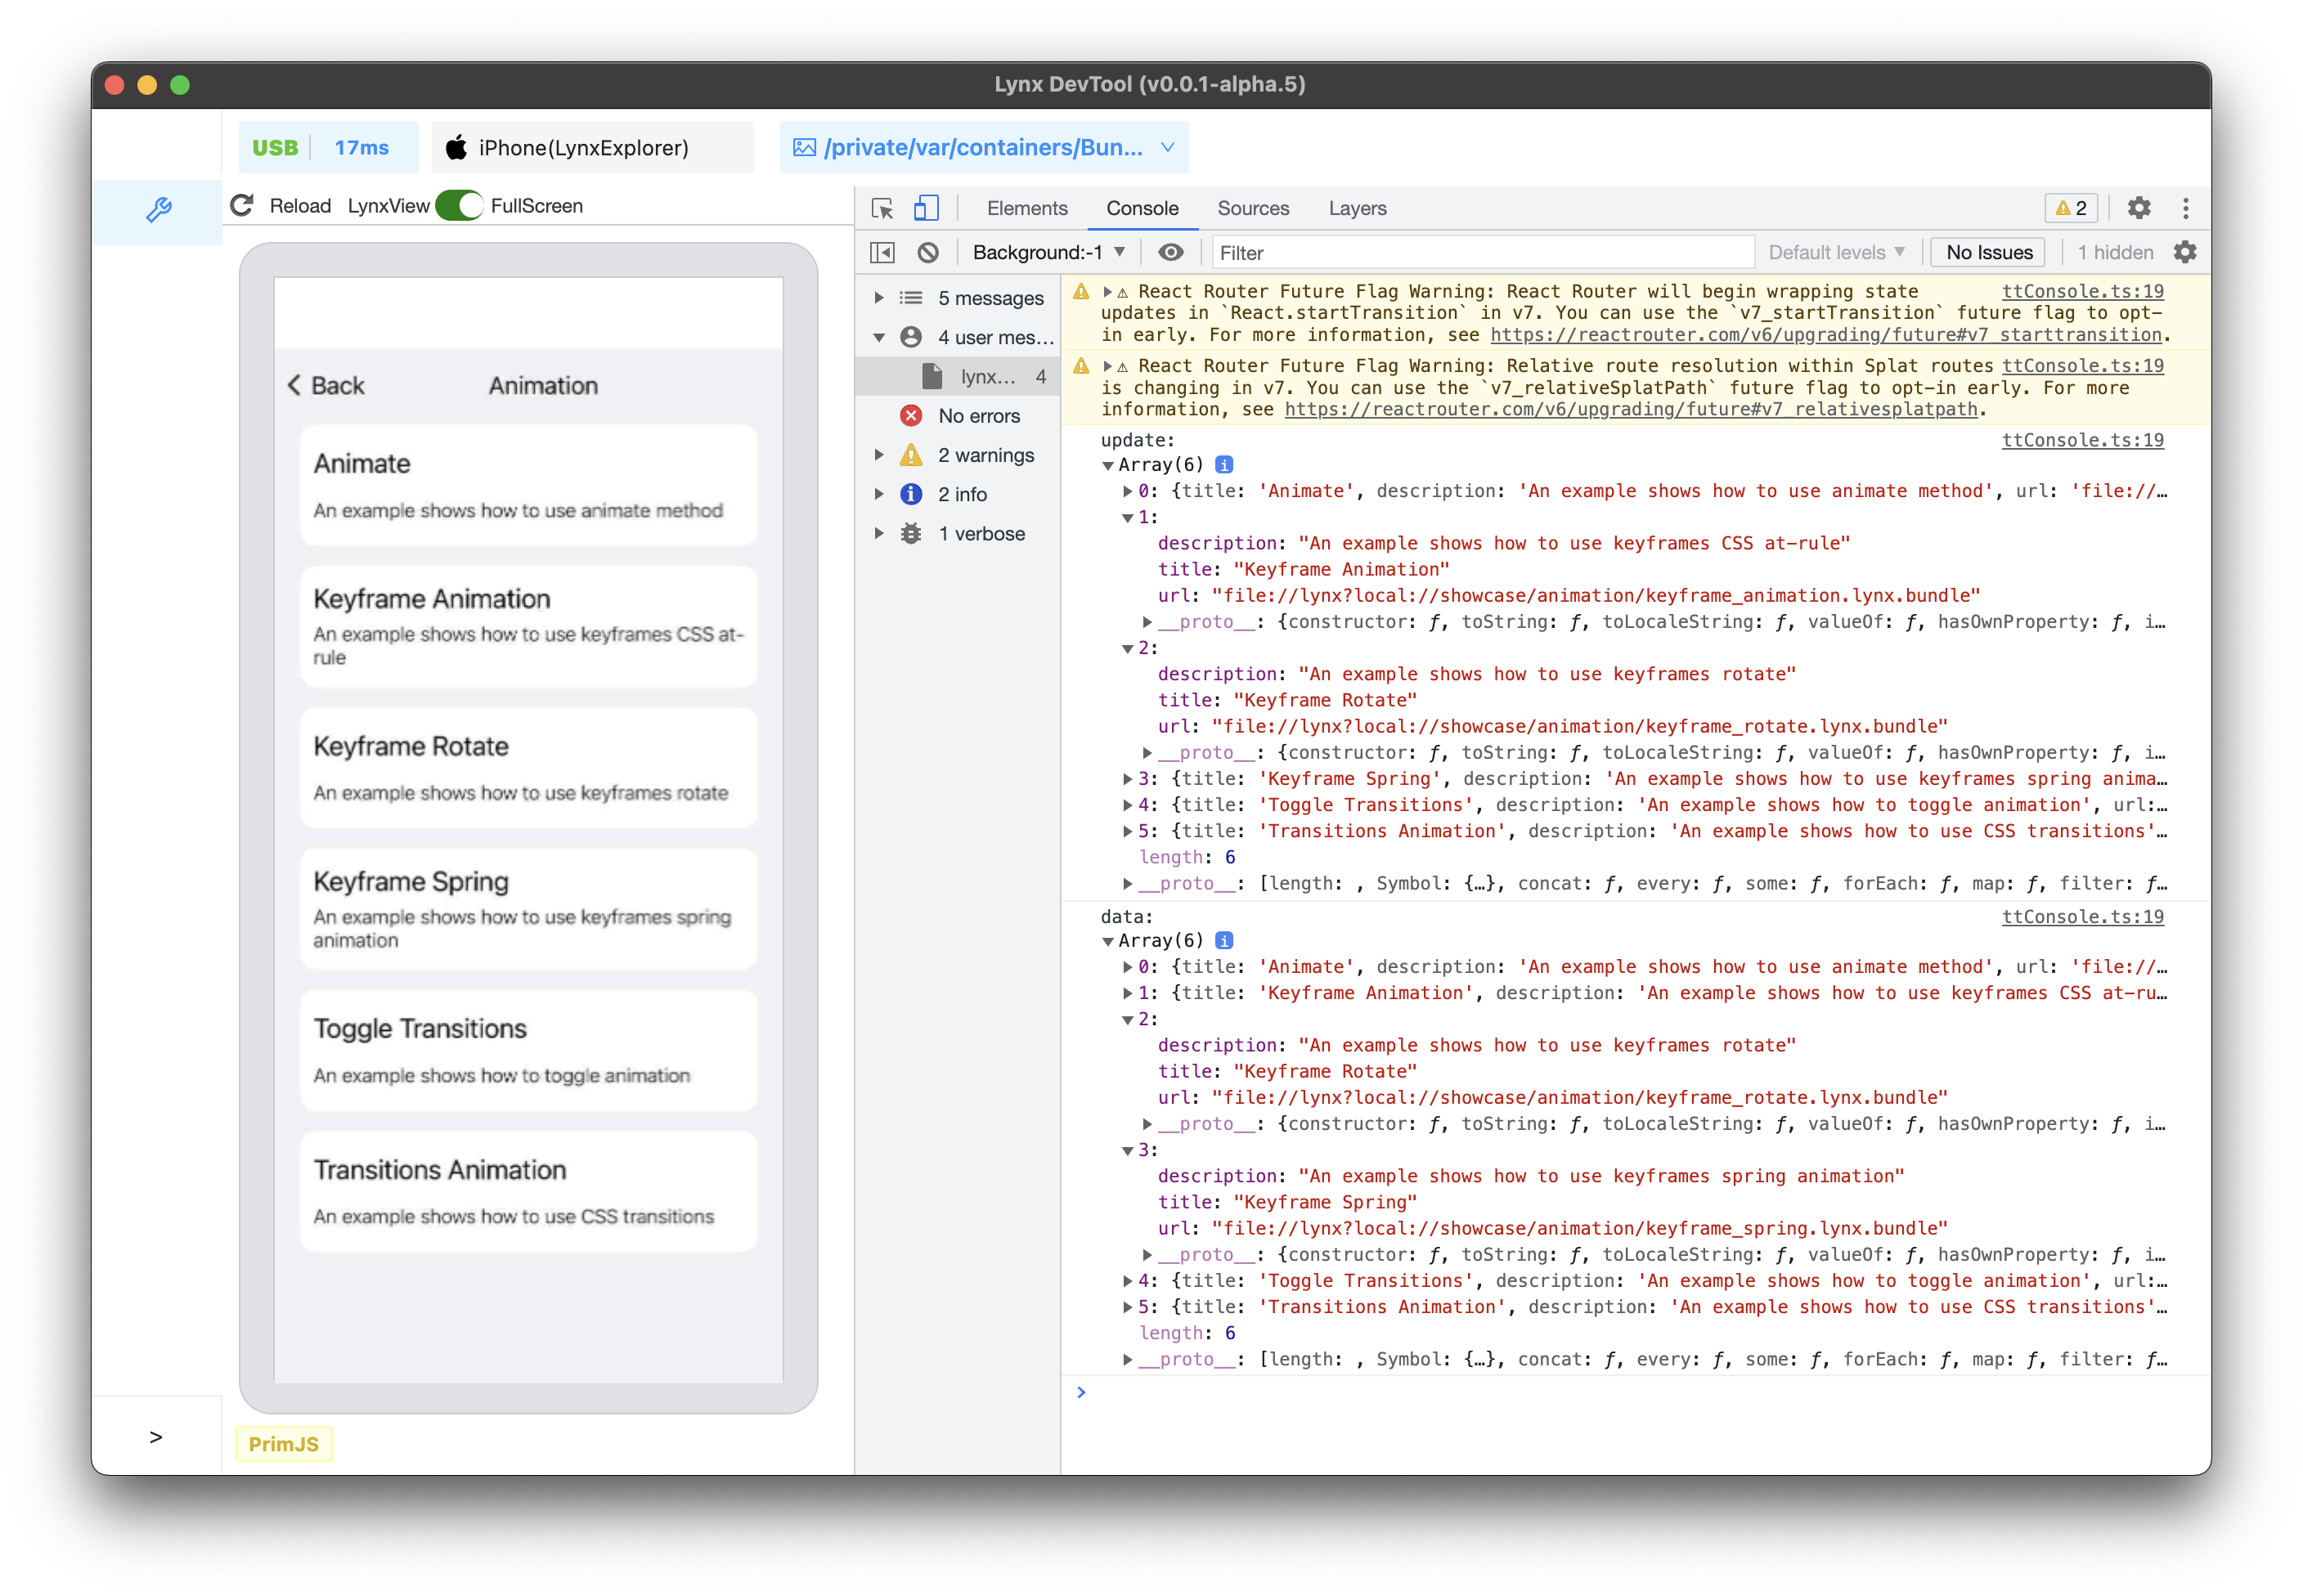
Use the Console panel to view logged messages and run JavaScript.
Sources
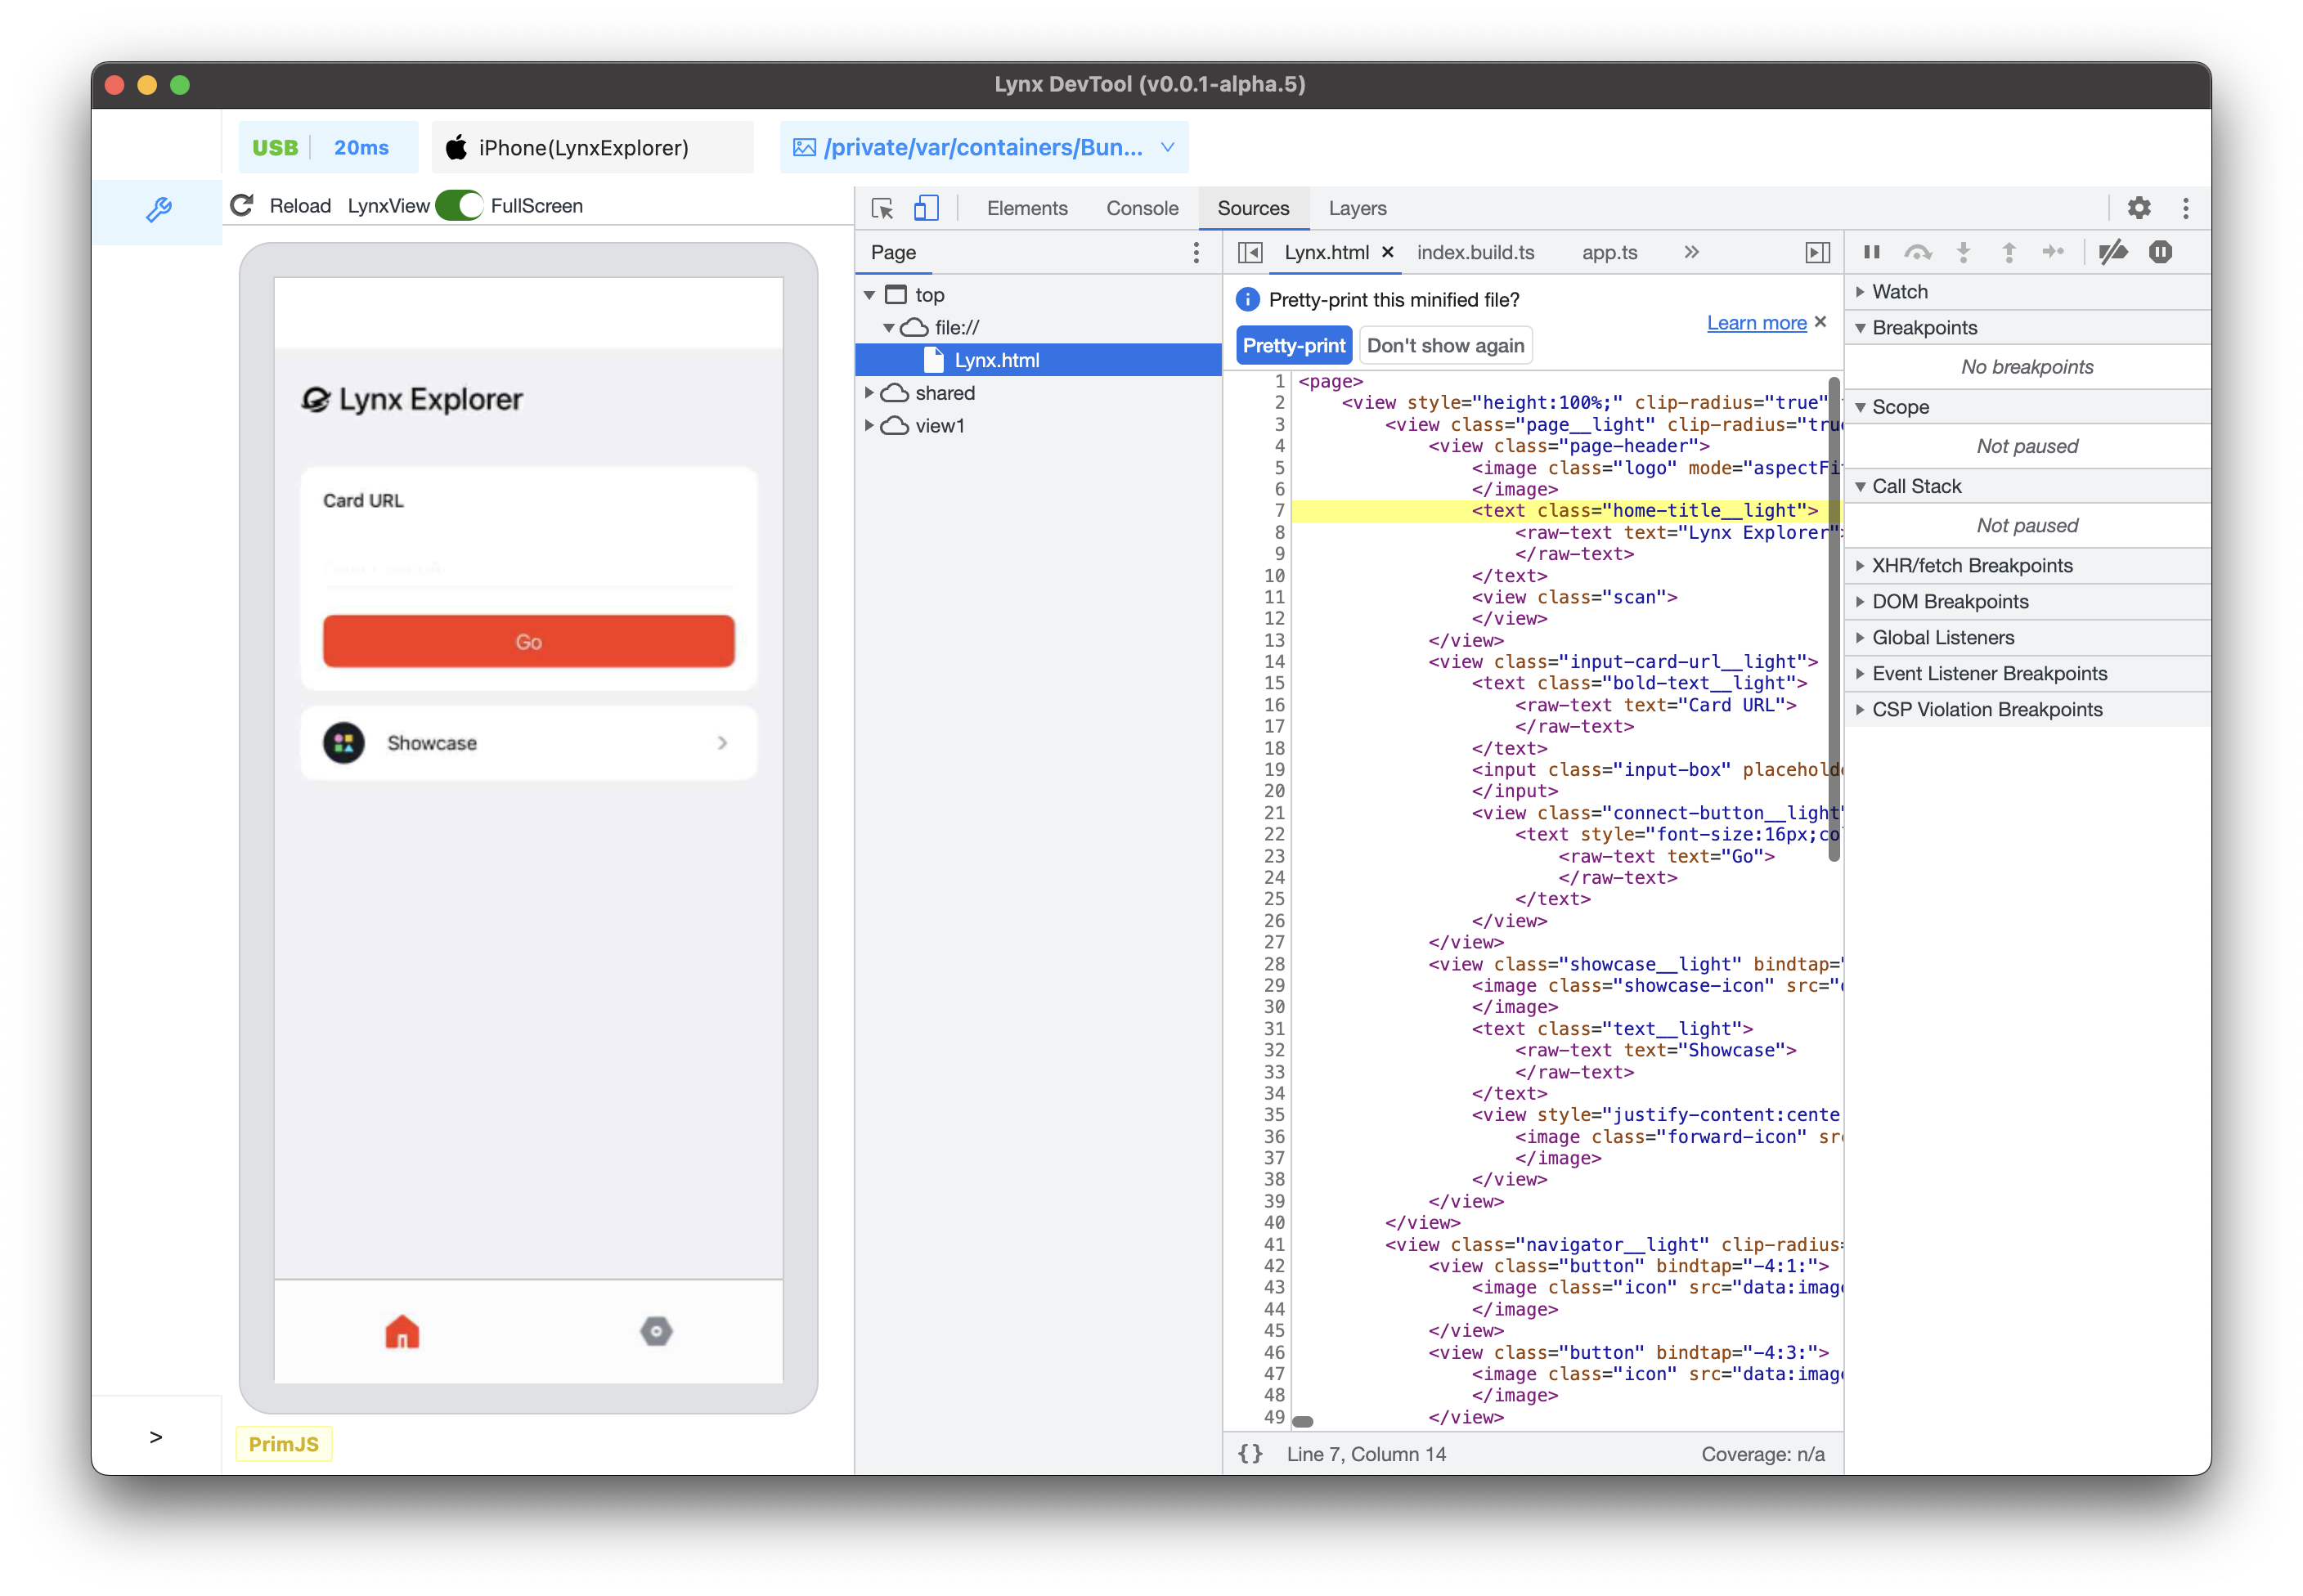
Use the Sources panel to debug JavaScript.
- File Navigation
- Pause Code with Breakpoints
- Debug JavaScript
- Debug Original Code with Source Maps
- Debug the Main Thread
Layers
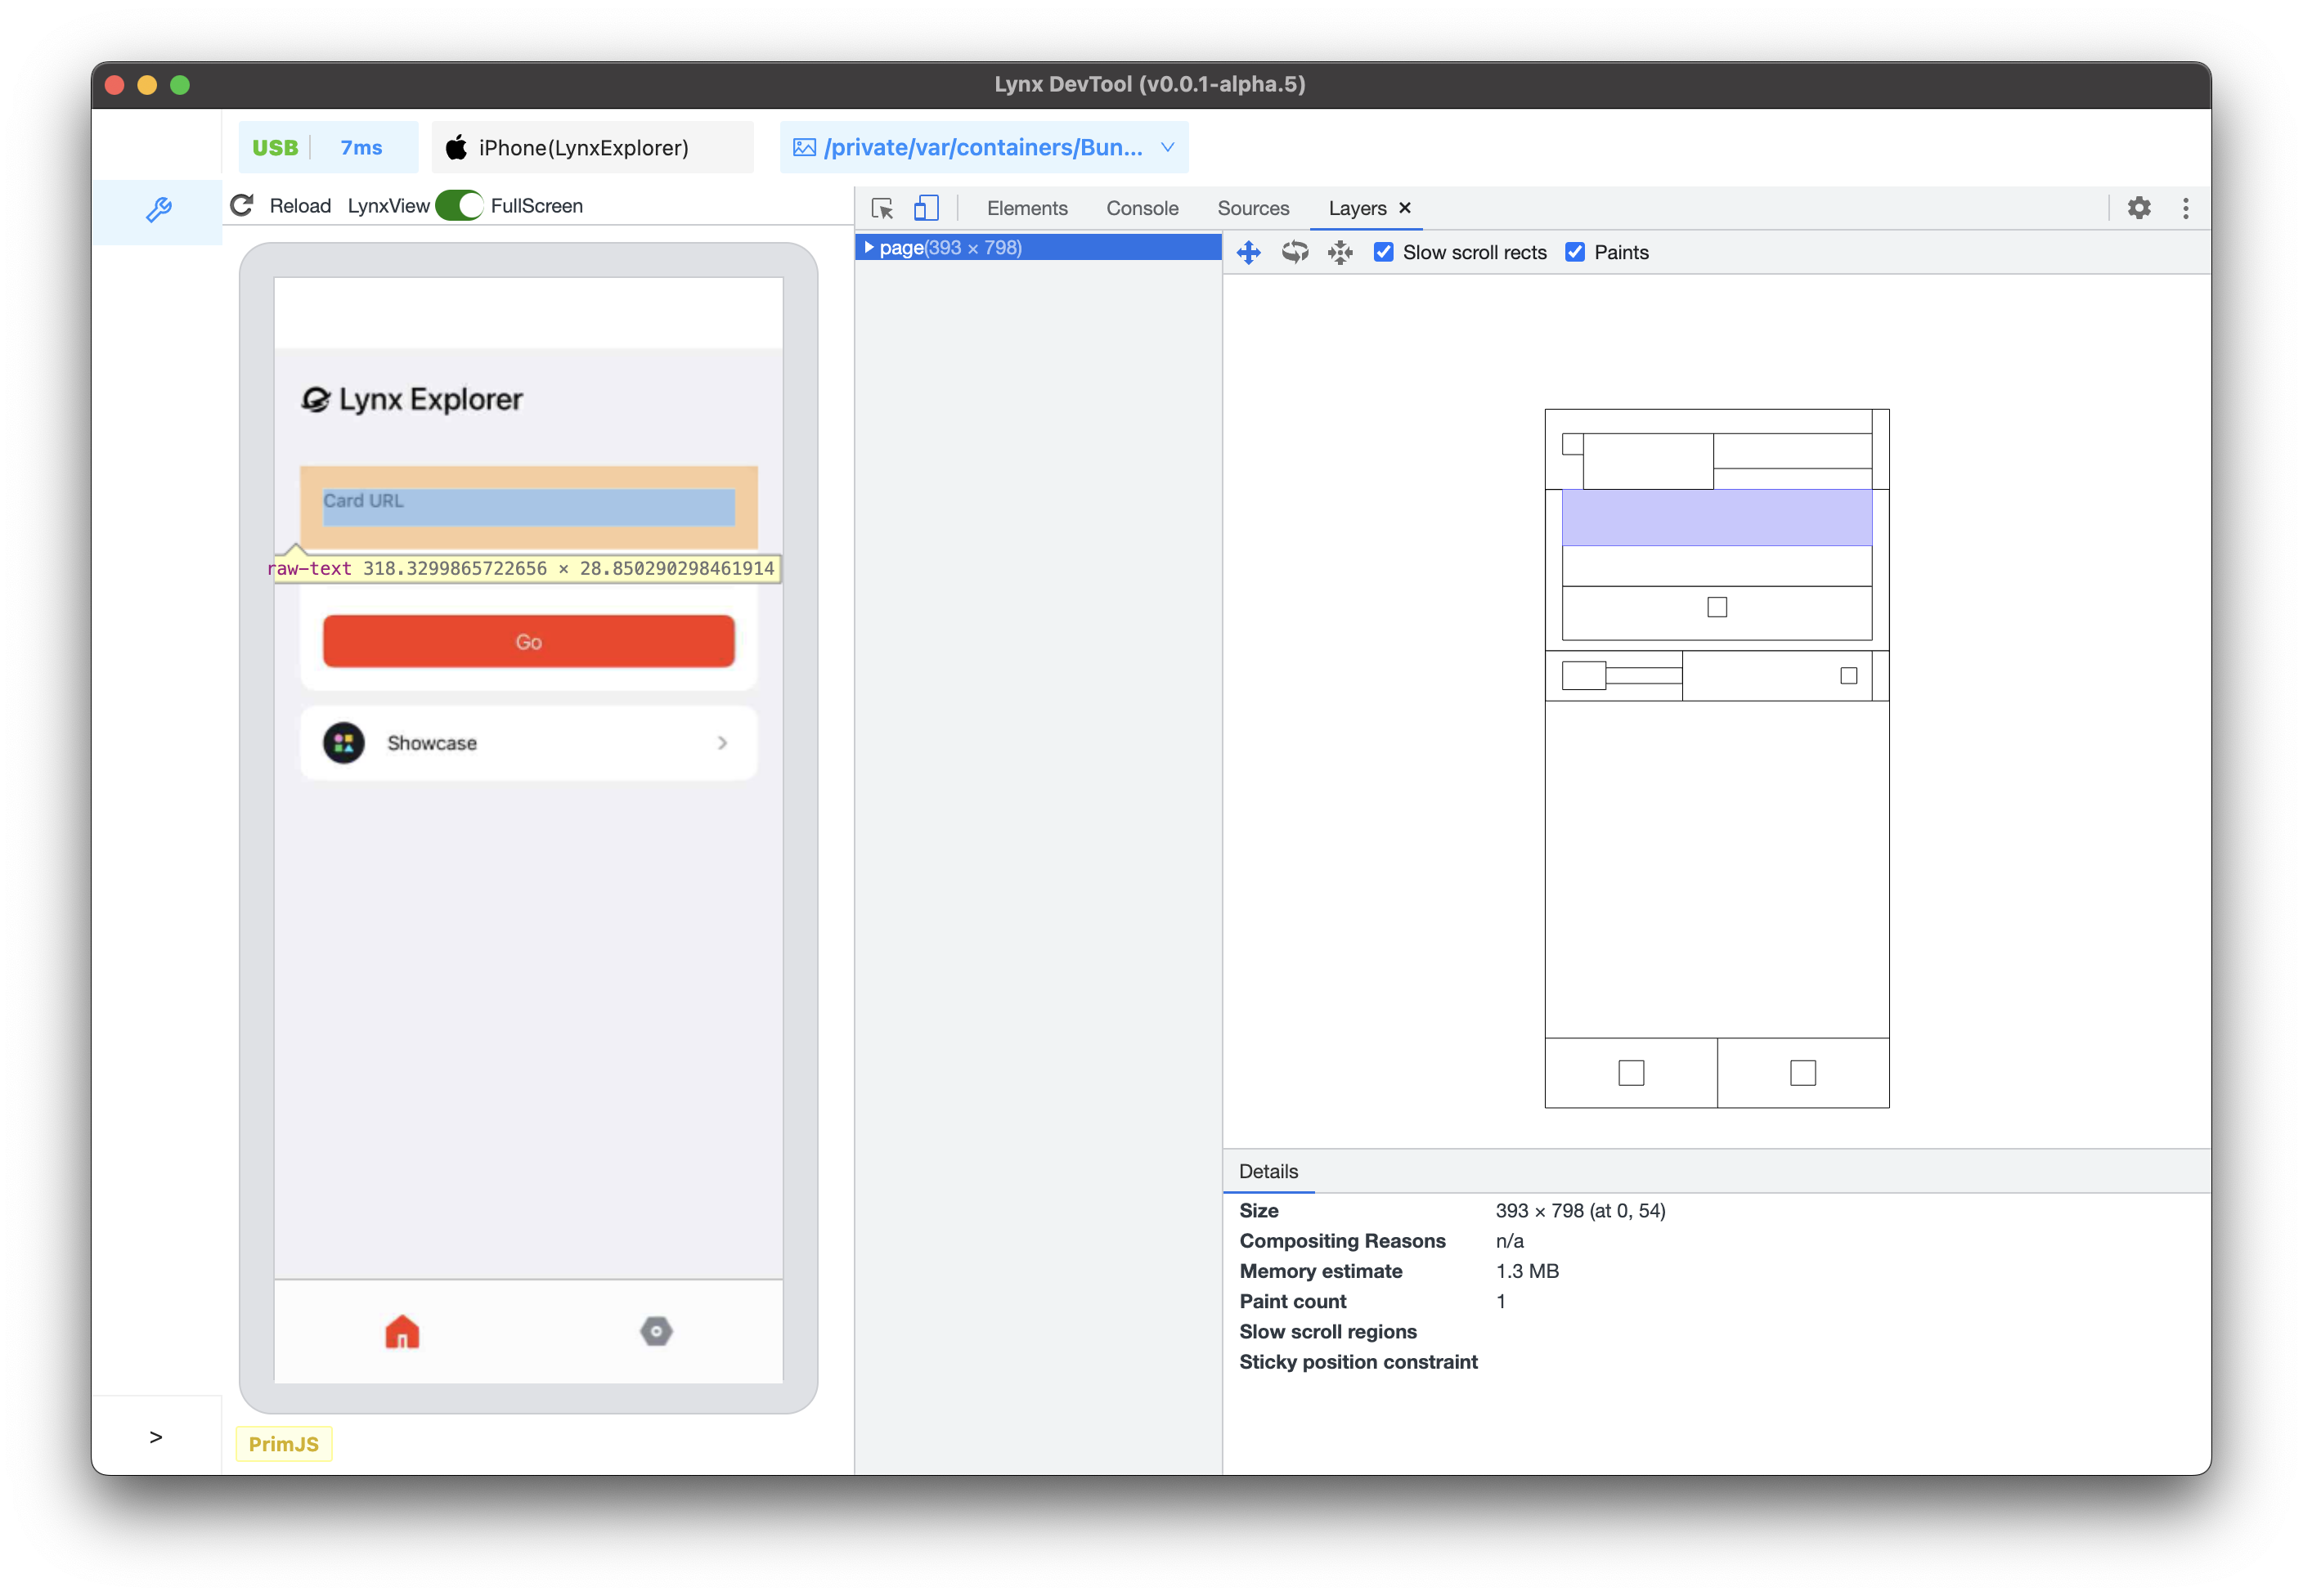
Helps you understand the composition of Lynx pages and how the framework presents content, analyzing its 3D layers to discover rendering issues.