Mark Rendering Pipelines
Lynx Pipeline defines the complete process from triggering the rendering to displaying it on the screen. If you care about rendering performance of certain key components, you can set the component’s __lynx_timing_flag property to mark its Lynx Pipeline and monitor its performance.
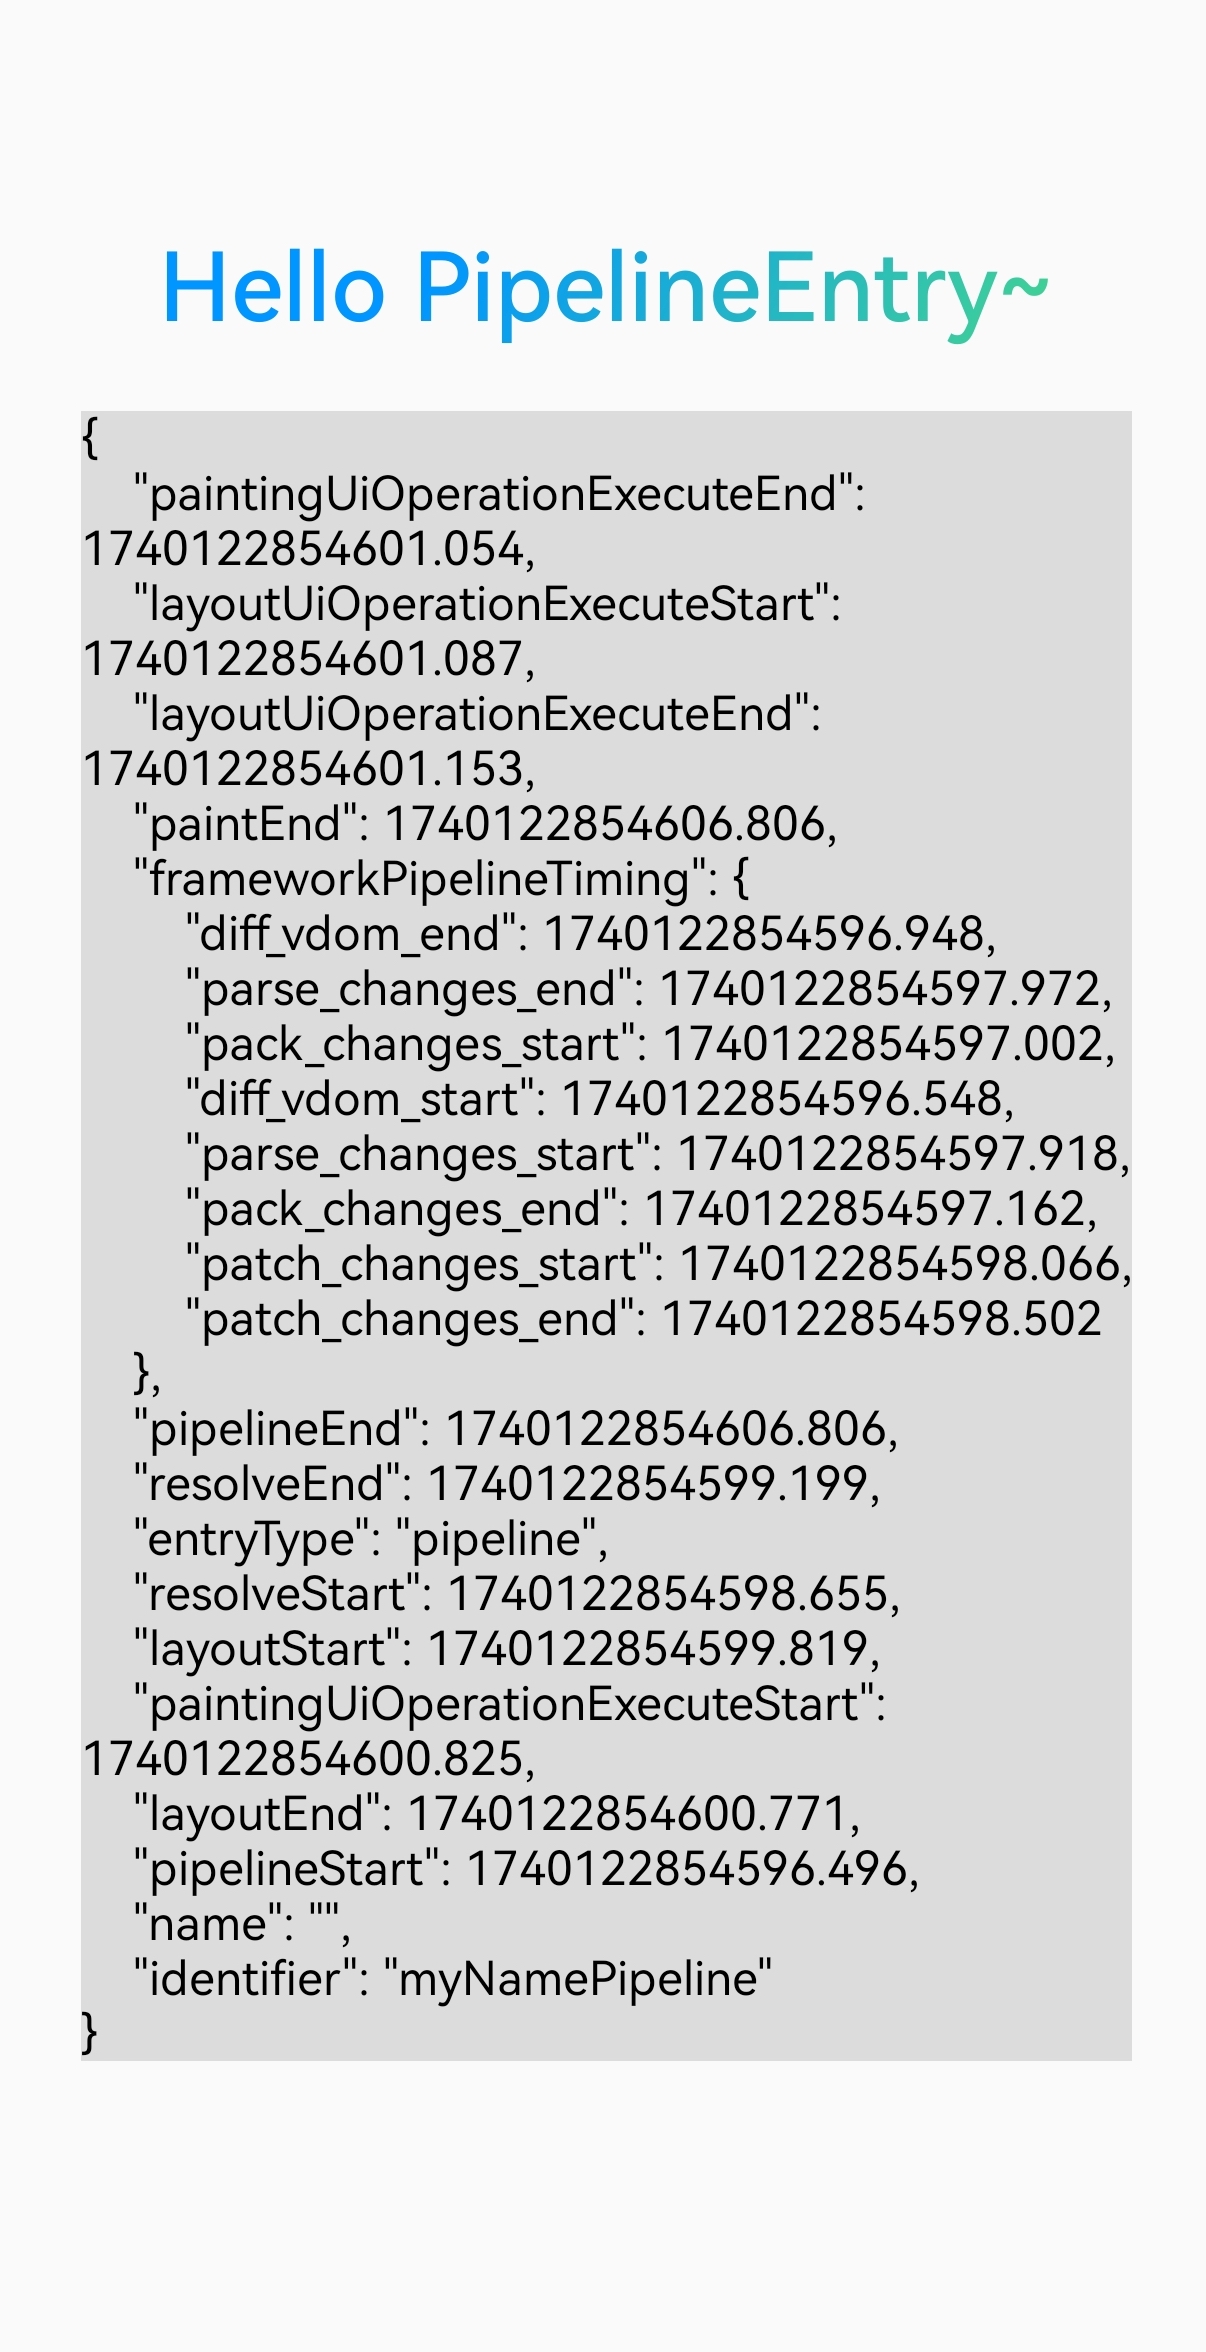
When the flagged Lynx Pipeline finishes and the screen is refreshed, a PipelineEntry performance event is generated. You can obtain it via PerformanceObserver.
Usage rules
- The
__lynx_timing_flagattribute must be a non-empty string. Empty values or invalid types will not triggerPerformanceObservercallbacks. - When the
__lynx_timing_flagattribute value is__lynx_timing_actual_fmp, an additionalMetricActualFmpEntryperformance event is generated.
Examples
- Mark a node: set the
__lynx_timing_flagattribute on the target component. When the node finishes rendering, the framework automatically collects performance data for its Lynx Pipeline. - Get data: register an observer (
PerformanceObserver) vialynx.performance.createObserver()to receive the corresponding performance data (PipelineEntry).
Notes
1. Multiple components set the same __lynx_timing_flag attribute
In this case, only the Lynx Pipeline data of the first component that appears on screen will be recorded:
- Compute
ActualFMPonce and send oneMetricActualFmpEntry. - Send one
PipelineEntry.
If you want to record the moment when both components finish rendering, use different __lynx_timing_flag values.
2. The same component renders multiple times
In this scenario, only the Lynx Pipeline data for the component’s first appearance is recorded:
- Compute
ActualFMPonce and send oneMetricActualFmpEntry. - Send one
PipelineEntry.
If you need to measure each render individually, implement as follows:
Compatibility
LCD tables only load in the browser