Performance API
Concepts and usage
Measuring and analyzing performance metrics is critical to ensure the speed and user experience of Lynx applications. Similar to the Web standard, Lynx provides the Performance API as a standardized interface to measure Lynx app performance, helping developers monitor comprehensive metrics from initialization through rendering completion.
Performance entry types
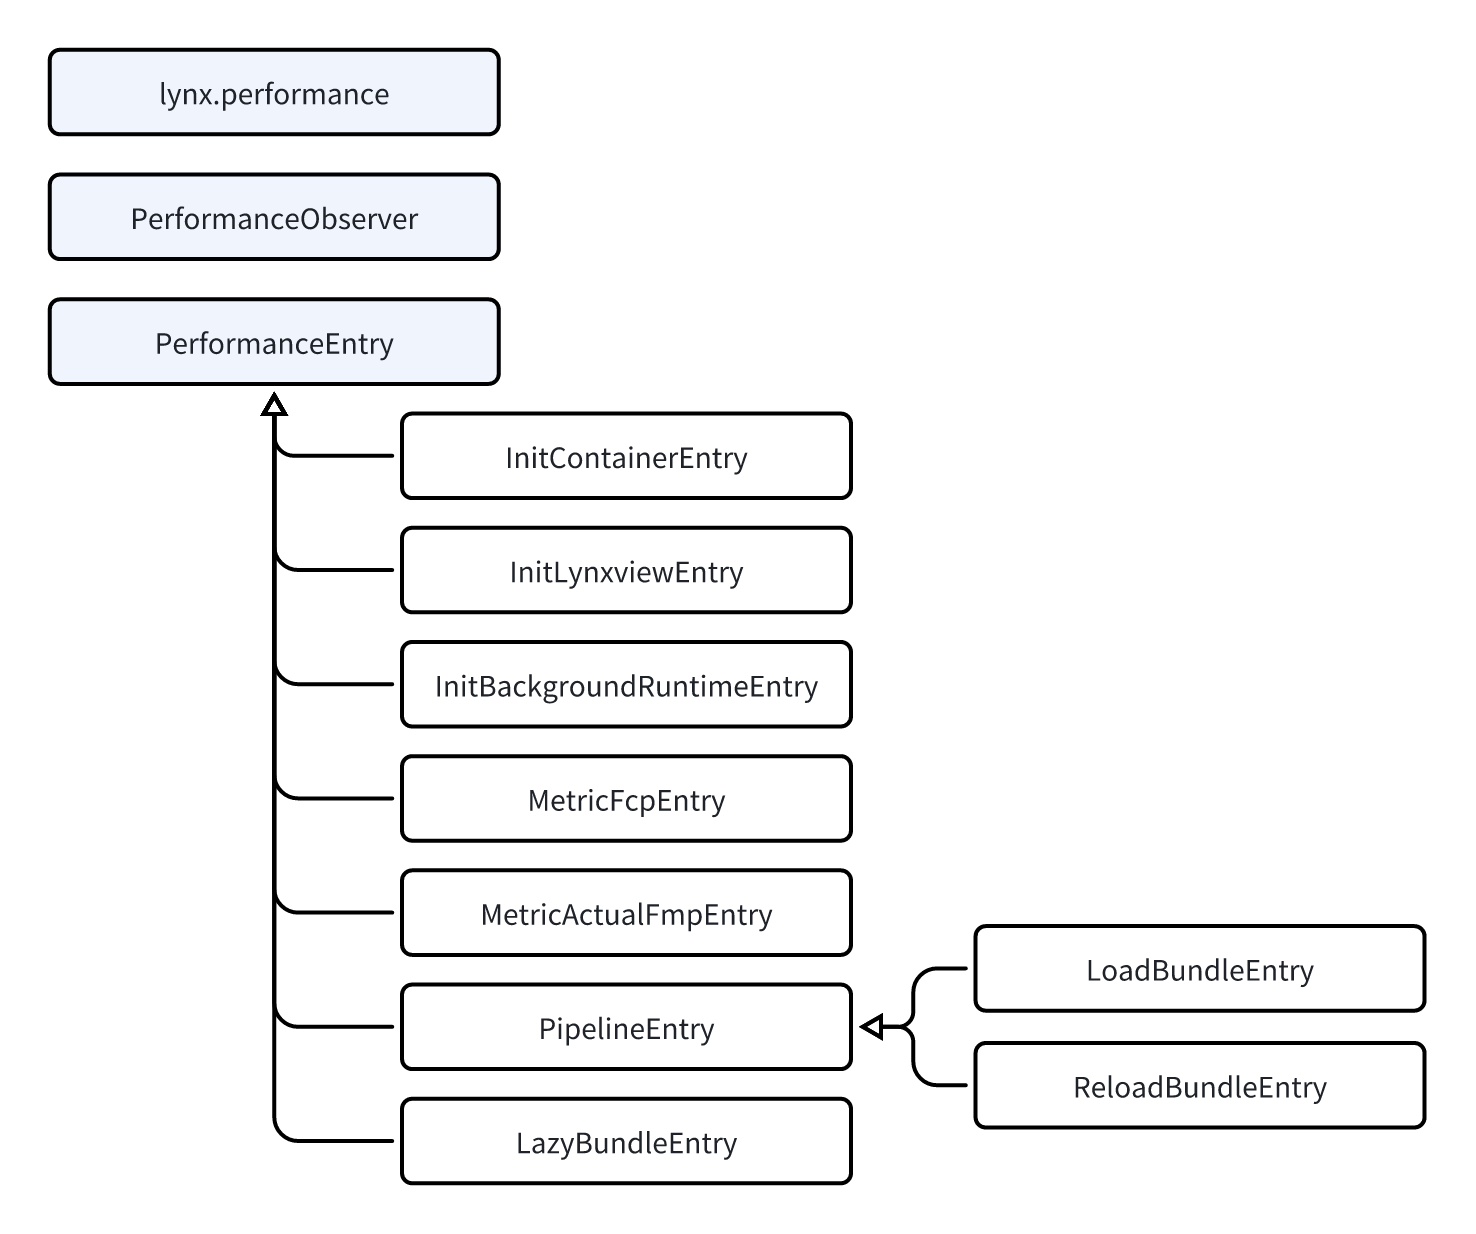
The core of the Performance API is the PerformanceEntry object, which is the fundamental data structure describing a performance event. Each PerformanceEntry has the following basic properties:
entryType: The type of performance event (e.g.,init,metric,pipeline,resource)name: The specific name of the performance event- Other type-specific properties and timestamps
Based on the entryType property, the Performance API supports four main categories of performance events:
-
Initialization events (
init)InitContainerEntry: Container initialization performance eventInitLynxviewEntry: LynxView initialization performance eventInitBackgroundRuntimeEntry: Background runtime initialization performance event
-
Metric events (
metric)MetricFcpEntry: FCP (First Contentful Paint)MetricActualFmpEntry: ActualFMP (Actual First Meaningful Paint)
-
Rendering pipeline events (
pipeline)PipelineEntry: Performance event for flagged rendering pipelinesLoadBundleEntry: Performance event for TemplateBundle loading and first-screen renderingReloadBundleEntry: Performance event for reloading TemplateBundle
-
Resource loading events (
resource)LazyBundleEntry: Performance event for lazy-loaded TemplateBundle
Getting performance data
Front-end developers
To consume performance events, the Performance API provides PerformanceObserver, which notifies you when the Lynx Engine produces performance events (PerformanceEntry).
The PerformanceObserver object offers the observe method to start observing and the disconnect method to stop. With them, you can observe by entryType (all entries of a type) or entryType.name (a specific kind of entry).
To prevent missing events due to late registration, register observations as early as possible.
-
Component dependencies
@lynx-js/react>= 0.107.0
-
Registration timing
- Class components: register in the constructor
- Function components: register in useMemo
The following example shows how to create a PerformanceObserver and observe metric.fcp and pipeline events.
Client developers
On the client side, performance events sent by the Performance API are delivered via the onPerformanceEvent(PerformanceEntry entry) callback on LynxViewClient on an asynchronous thread. It is therefore not recommended to perform any UI-related operations inside this callback.
Capture specific rendering pipelines
A rendering pipeline is the complete process from triggering the rendering to displaying it on the screen. If you care about the rendering performance of certain key components, set the component’s __lynx_timing_flag property to mark the pipeline it belongs to and monitor its performance.
When the flagged rendering pipeline completes and the screen is refreshed, a PipelineEntry event is generated. You can retrieve it via PerformanceObserver.
Build custom performance metrics
Different business goals imply different metrics to focus on. Your use of the Performance API need not be limited to built-in Lynx metrics—you can flexibly combine timestamps from different PerformanceEntrys at key points to construct a metric suite tailored to your application.
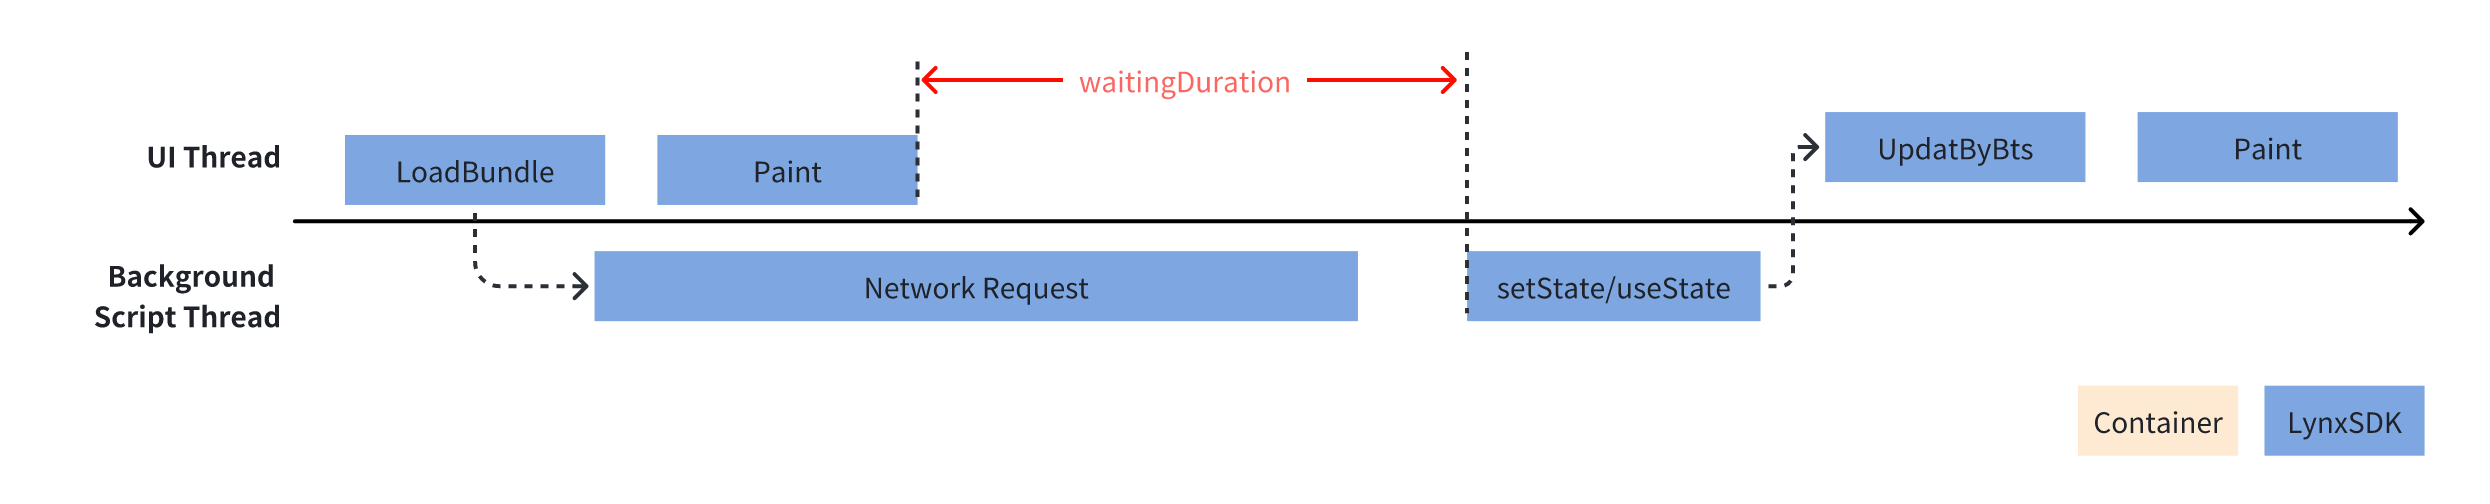
For example, if you want to measure the latency from the end of first-screen rendering to the first important data update, you can combine LoadBundleEntry and PipelineEntry to compute a custom metric waitingDuration as shown below. It helps monitor the speed of network requests, file IO, etc., and pinpoint causes of performance regressions.
Best practices
1. Register observers early
To avoid missing events due to late registration, register observations as early as possible:
- Register in the class component
constructor, or inuseMemofor function components
2. Choose an appropriate observe scope
Select the observe scope based on your needs:
3. Clean up promptly
When a component unmounts or observation is no longer needed, call disconnect() to release resources:
FAQ
Q1: If my page uses Instant First-Frame Rendering (IFR), do I still need to mark a Timing Flag?
For pages with Instant First-Frame Rendering (IFR), you generally do not need to manually mark a Timing Flag. However, if you do, you will still receive a LoadBundleEntry with an identifier value equal to the TimingFlag you marked.
Q2: My page uses Instant First-Frame Rendering (IFR). How can I get the ActualFMP performance metric?
In scenarios with Instant First-Frame Rendering (IFR), you generally do not need to focus on the ActualFMP performance metric; you only need to pay attention to the FCP metric. The FCP metric can be obtained directly through MetricFcpEntry.
Q3: Can I get the rendering time of lazy-loaded components?
Yes. Marking Timing Flags on lazy-loaded components works the same as on the main page; you can use the Timing Flag inside the lazy-loaded component:
This method can be used to obtain the timestamp of the dynamic component rendering phase. For information about the time consumption of the dynamic component resource loading phase, refer to LazyBundleEntry.
Q4: Are Performance API callbacks related to other Lynx lifecycles?
Performance API triggers its callbacks after all rendering pipeline timestamps are captured—i.e., after pixels are on screen—and has no strict ordering relationship with other Lynx lifecycles.
Q5: Which is triggered faster, a setState callback or a Performance API callback?
See Q4: there is no defined ordering.
Q6: Can Timing Flags be reused?
No. If two identical Timing Flags are injected, Performance API fires on the first one it detects and will not fire again for the second.
Q7: What happens if the client calls ReloadTemplate, calls LoadTemplate multiple times, or the front end calls reload?
Before Lynx 3.4: Performance API state resets; LoadBundleEntry will be triggered again with timestamps from this template load. If front-end reloads but the page has no UI to redraw, no callback is received.
After Lynx 3.4: Multiple LoadTemplate calls yield multiple LoadBundleEntry events; client ReloadTemplate and front-end reload yield ReloadBundleEntry.
Q8: Why don’t I receive the LoadBundleEntry callback?
Possible causes:
- First-screen rendering produced no pixels, e.g., LynxView width/height is 0, LynxView is off-screen, or LynxView wasn’t added to the window.
- The observer was registered too late; try registering earlier:
- register in the class constructor or
useMemo
- register in the class constructor or
Q9: I used an Timing Flag—why don’t I receive PipelineEntry callbacks?
Possible causes:
- Observer registered too late (see Q8)
- Timing Flag is set on a Component while the
removeComponentElementswitch is enabled, making the Timing layer unable to detect the flag - Timing Flag is ineffective on tags with no UI nodes, such as
<inline text/>,<block/>,<template/> - The same Timing Flag does not trigger multiple callbacks (see Q6)
Q10: How do I verify that Timing Flag integration works?
You can validate via local Trace, or by registering an observer and checking whether callbacks fire.
Q11: My ActualFMP metric is particularly large—why?
Check whether preloading is in effect; with preloading, the starting point of ActualFMP can be very early.
Q12: Error “OnPipelineStart arg count must == 1”
To fix this, upgrade @lynx-js/react to version 0.107.1 or higher.