Fluency Analysis
When scrolling occurs, the system attempts to draw the next frame at a fixed cadence; any noticeably longer draw interval will be perceived by users as a “stutter” or “jitter.” These momentary long frames are the source of “dropped frames.” Scrolling is the most cadence-sensitive scenario, because backgrounds, text, and images are continuously moving; once the beat becomes unstable, the eye immediately notices.
Offline Trace analysis
Offline Trace aims to reconstruct the frame timing of a scrolling interaction, tie “which segment dropped frames” to “why it dropped,” and produce actionable fixes. For Trace capture, see Record Trace and ensure the capture covers the full scrolling time window and realistic scroll speed.
How Trace displays dropped frames
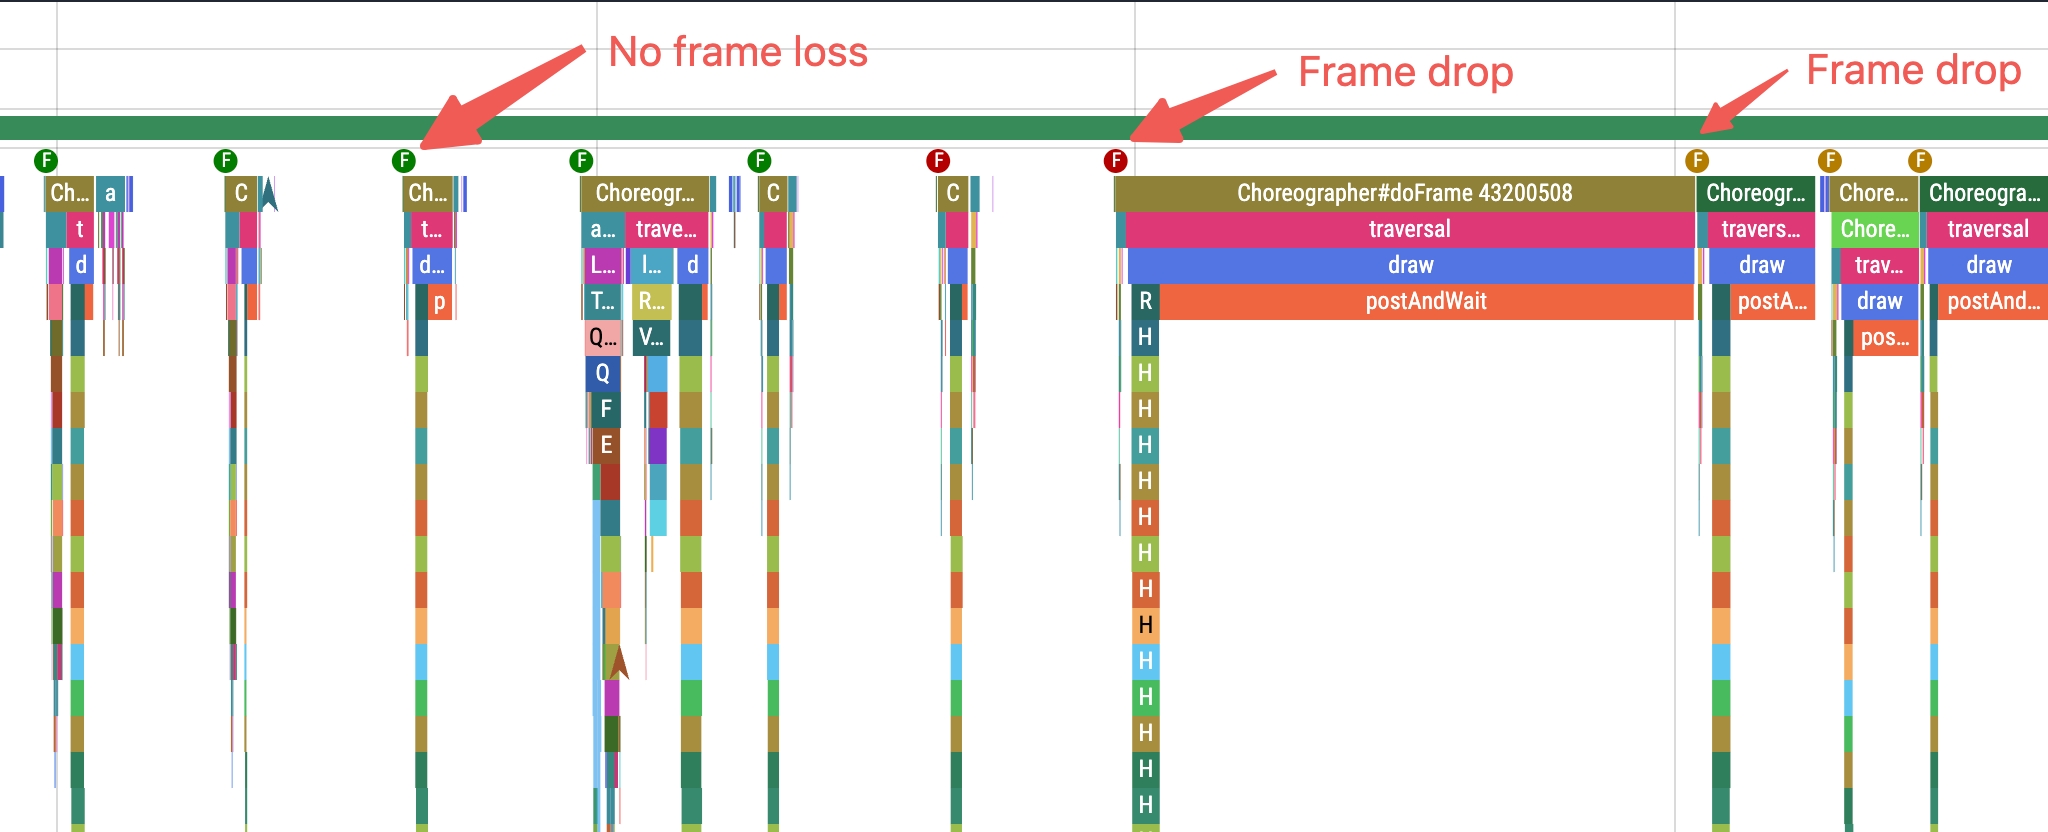
In the Trace webpage, frame render time labels were added at the start of Choreographer#doFrame (currently Android only). These labels display dropped-frame situations throughout the entire system render process. By observing these labels, you can visually identify render-time anomalies. Frame render time is computed by summing the time spent in Choreographer#doFrame on the UI thread and DrawFrames on the RenderThread. If the total is ≥ 32 ms, the label is red; if the total is ≥ 16 ms and < 32 ms, the label is orange; if the total is < 16 ms, the label is green. For offline analysis, treat frames marked red or orange as the tasks most likely causing dropped frames and analyze them preferentially.
Locating dropped-frame segments during scrolling
- On the timeline, look for frames that clearly exceed the cadence (for example, consecutive red labels) and mark them as “long-frame segments.”
- Analyze frame by frame to confirm whether the cause is UI-thread congestion, delayed render submission, or resource loading/decoding inserted into the critical path.
- Associate long-frame segments with UI elements (large images, complex list items, card animations) to form actionable ties to what users see.
Root-cause patterns and identification
- UI thread blocking: layout and measurement stacking, or I/O running on the UI thread.
- Heavy layout and drawing: deep hierarchies, frequent reflow, or large-area repaint; concentrated text and image size computation; complex
Canvasdrawing. Symptom: a single frame’s computation time is unusually long and repeats with scroll. - Image and resource loading: decode, downsample, and texture upload blocking critical frames; async not truly isolated, or missing placeholders/preload. Manifestations:
GPUorRenderThreadqueues back up, correlated with image size or count.
Common investigation suggestions
- Reduce UI-thread workload: move non-essential computation and I/O off the UI thread; spread layout and drawing across frames to avoid “everything in a single frame.”
- Optimize layout depth and measurement: control hierarchy depth and constraints complexity; avoid repeated measurement; use compositing layers to reduce unnecessary repaint.
- Image and resource governance: constrain dimensions and size, use placeholders and preload; move decode and texture upload earlier or run in parallel; load on demand and reuse caches.
- JS and bridge: split long tasks and reduce synchronous calls; use throttling and batching to avoid high-frequency messages overwhelming the UI cadence.