

Console Panel
Overview
Use the Console panel to view logged messages and run JavaScript. Before you start debugging, please take some time to familiarize yourself with the Lynx JavaScript Runtime.
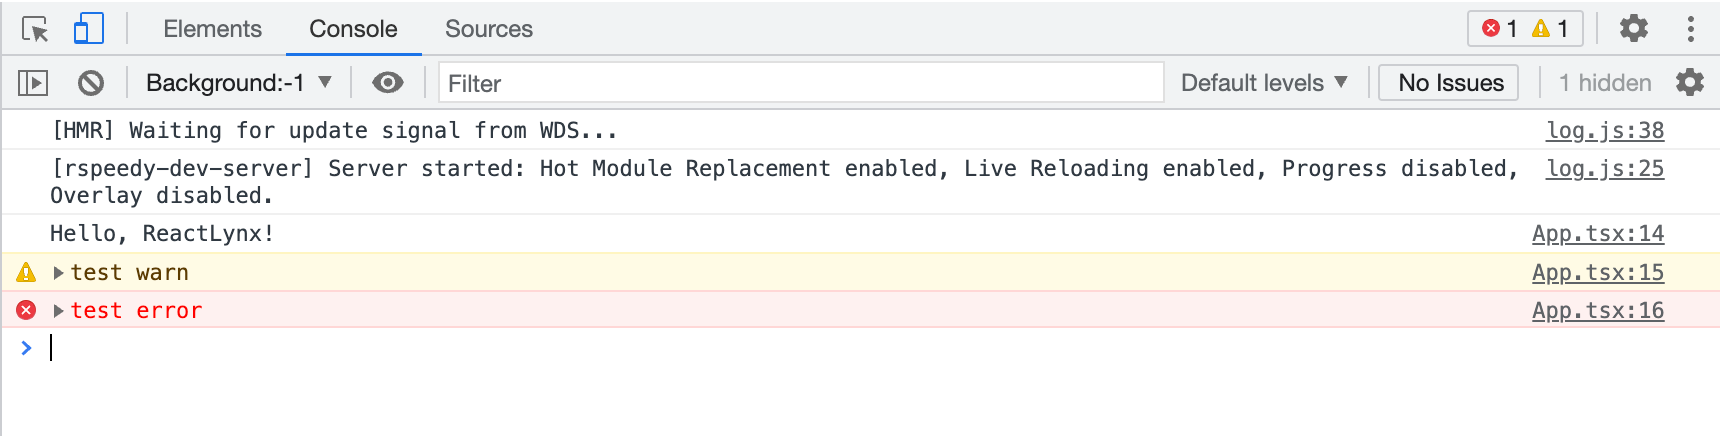
Open the Console Panel
The Console can be opened as a panel or as a tab in the Drawer.
Open in the Drawer
If you want to view the Console panel while using other panels, you can open the Console in the Drawer.
Please refer to Open the Console in the Drawer | Chrome DevTools.
Console Settings
 in the top-right corner of the Console panel.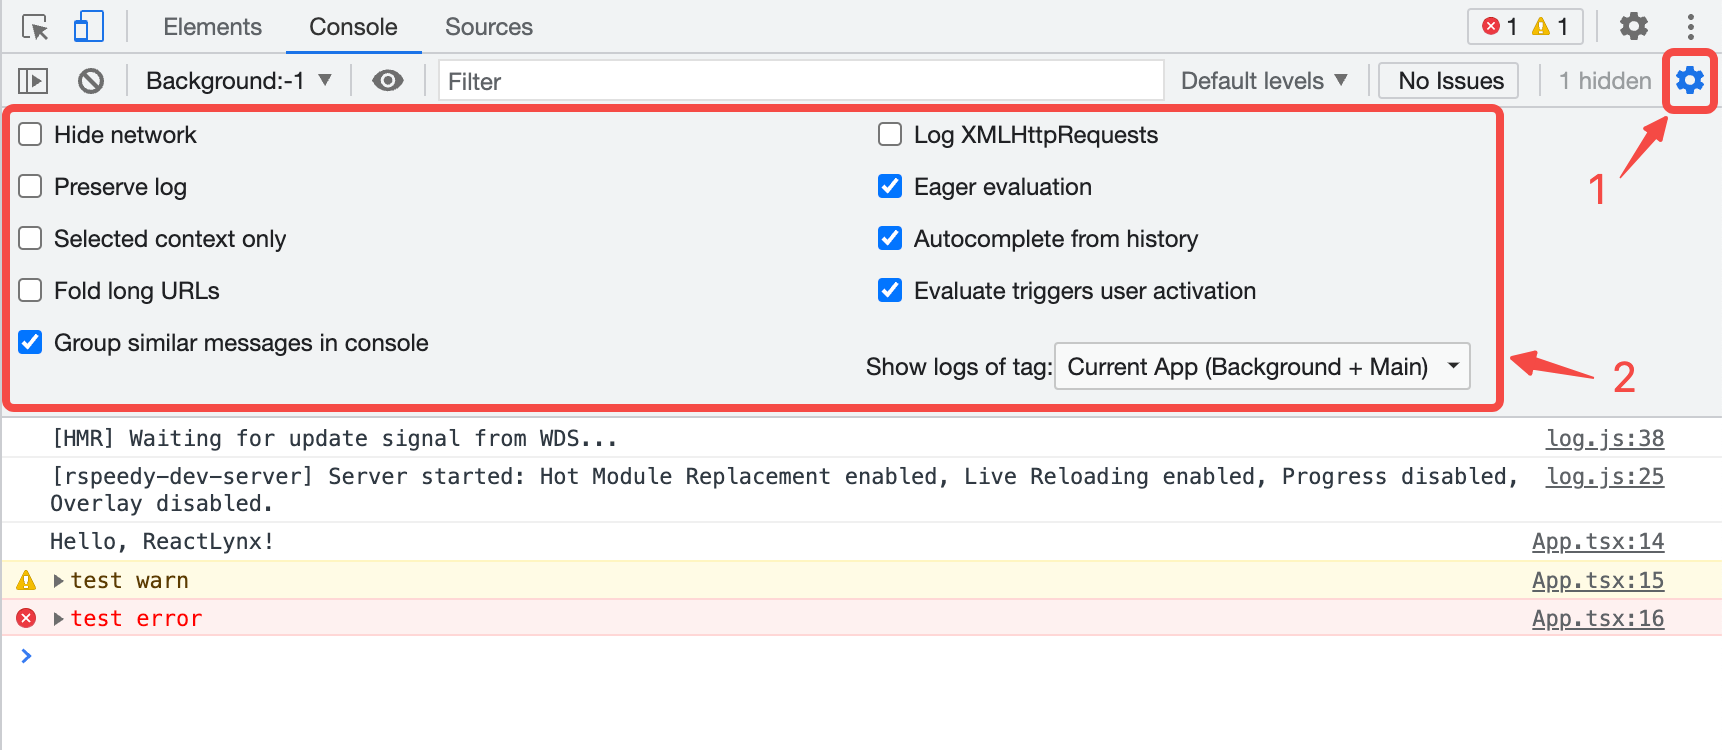
The following links explain each setting:
Console Sidebar
Please refer to Open the Console Sidebar | Chrome DevTools.
View Logged messages
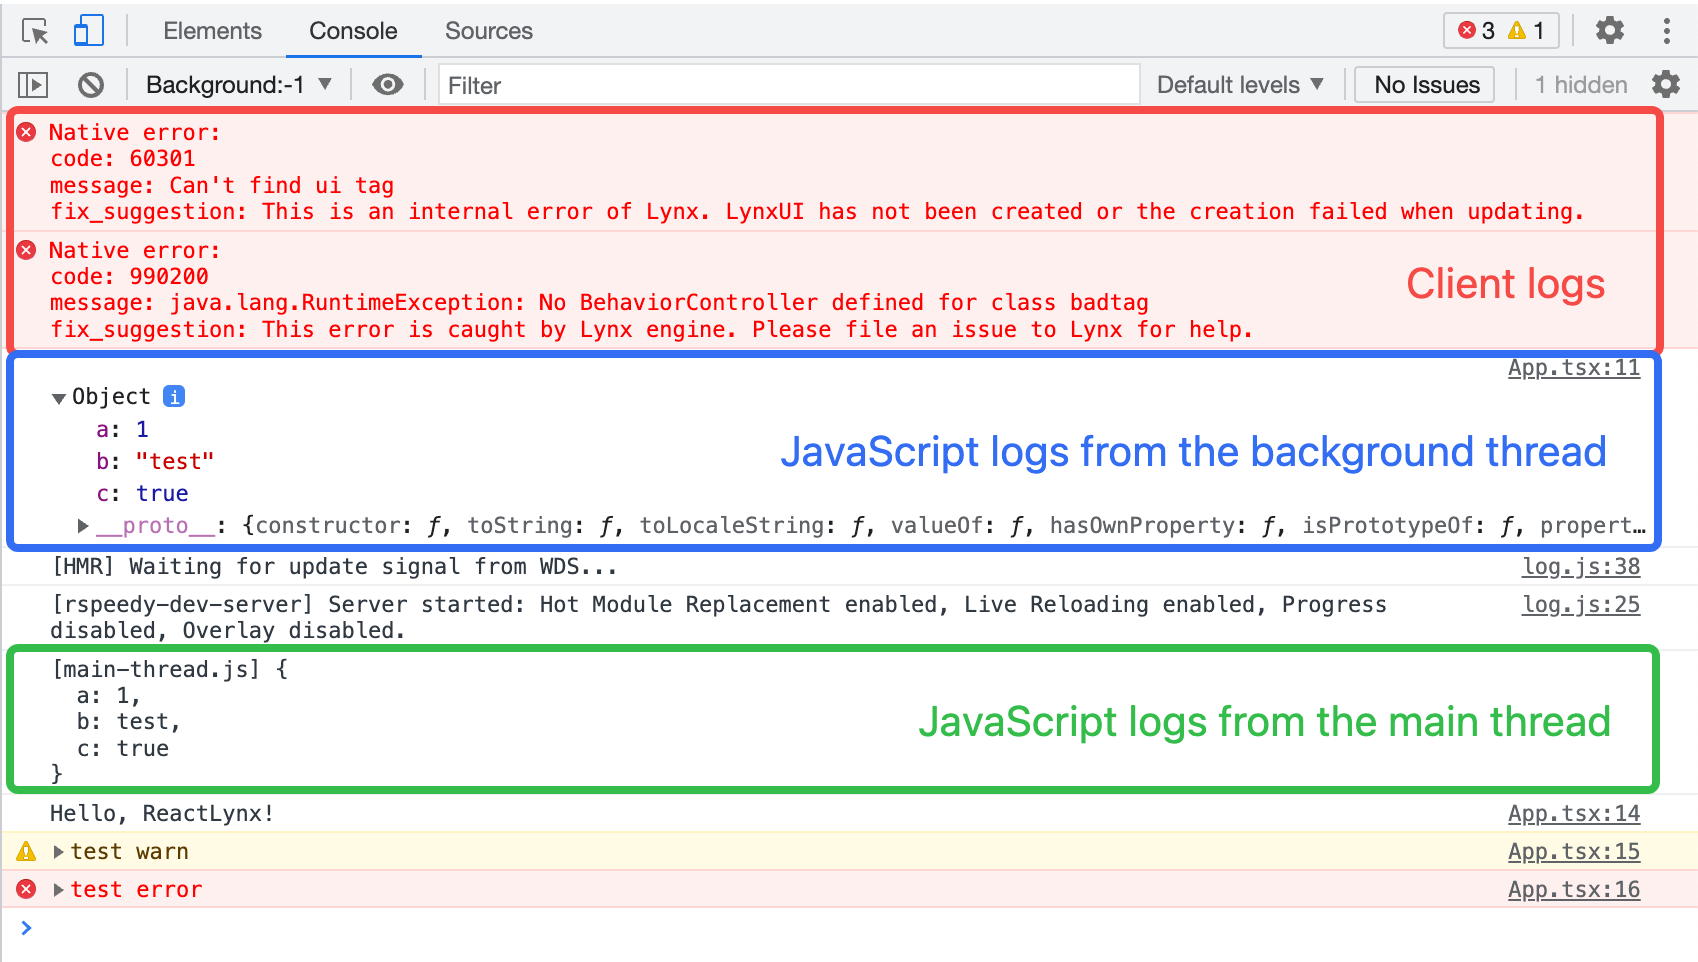
The types of logs currently can be viewed include:
-
JavaScript logs. Including the main thread and the background thread.
- By default, logs from the background thread are displayed in full format, while logs from the main thread are serialized as strings with the
[main-thread.js]prefix. - When Main Thread Debugging is enabled, logs from the main thread will also be displayed in full format.
- By default, logs from the background thread are displayed in full format, while logs from the main thread are serialized as strings with the
-
Some client logs.
Currently, client runtime errors and some other client logs are serialized as strings and displayed in the Console panel.
Log Sources
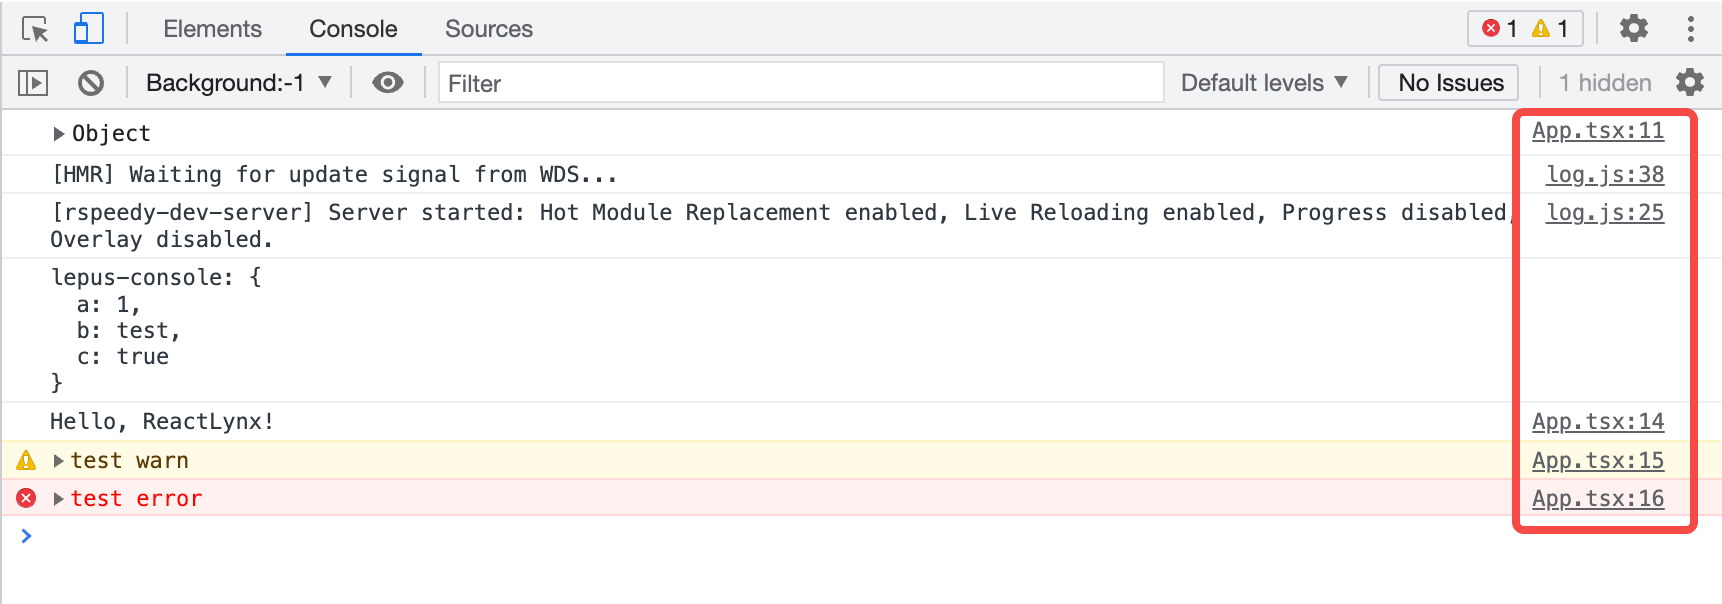
For JavaScript logs, the App.tsx:11 on the right side of the log represents where it logged. Clicking it will open the Sources panel and highlight the line of code that caused the message to get logged to the Console.
Disable Message Grouping
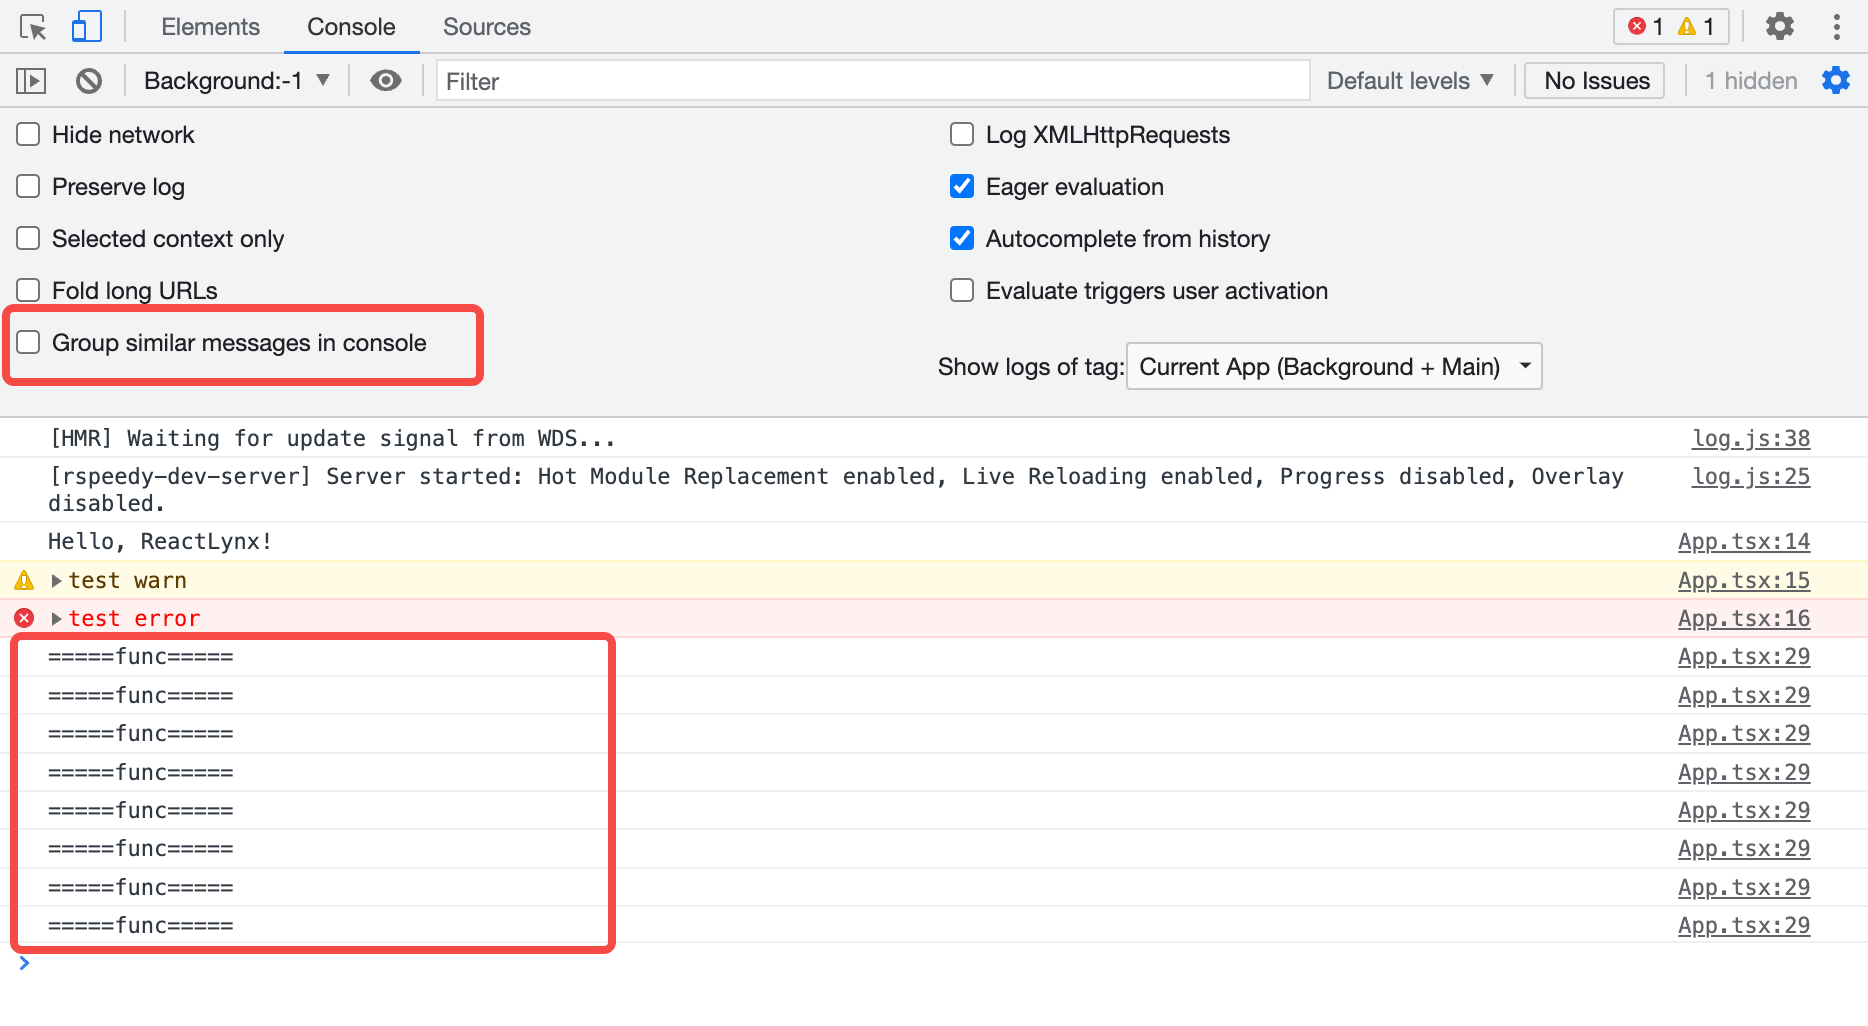
DevTool enables Group similar messages in console by default, which aggregates similar messages logged consecutively.
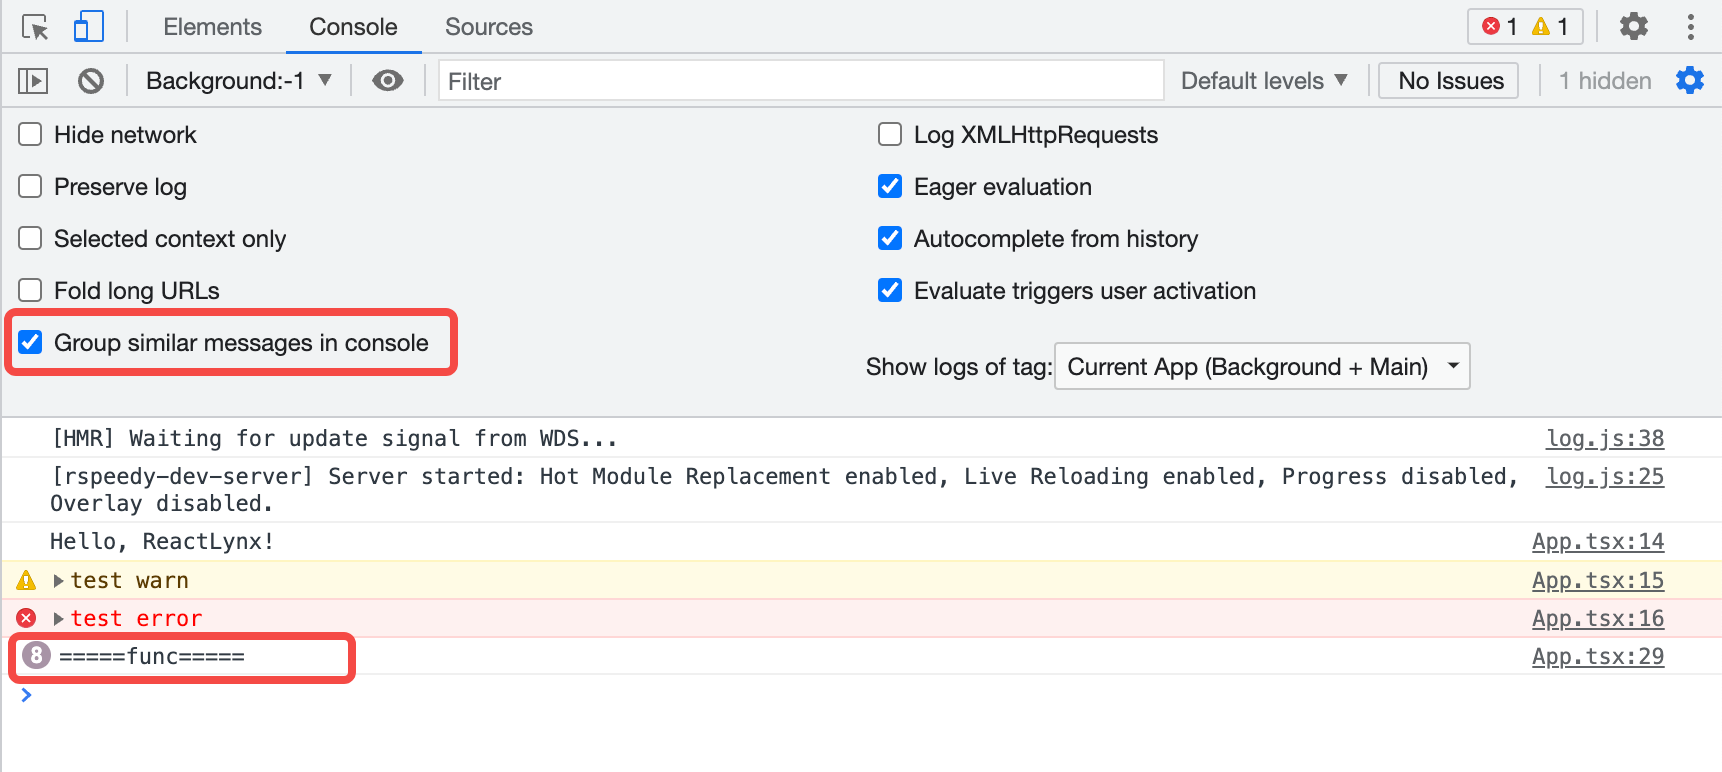
Open Console Settings and disable this option to expand the logs that were originally grouped.
View Stack Traces
 to view the stack trace.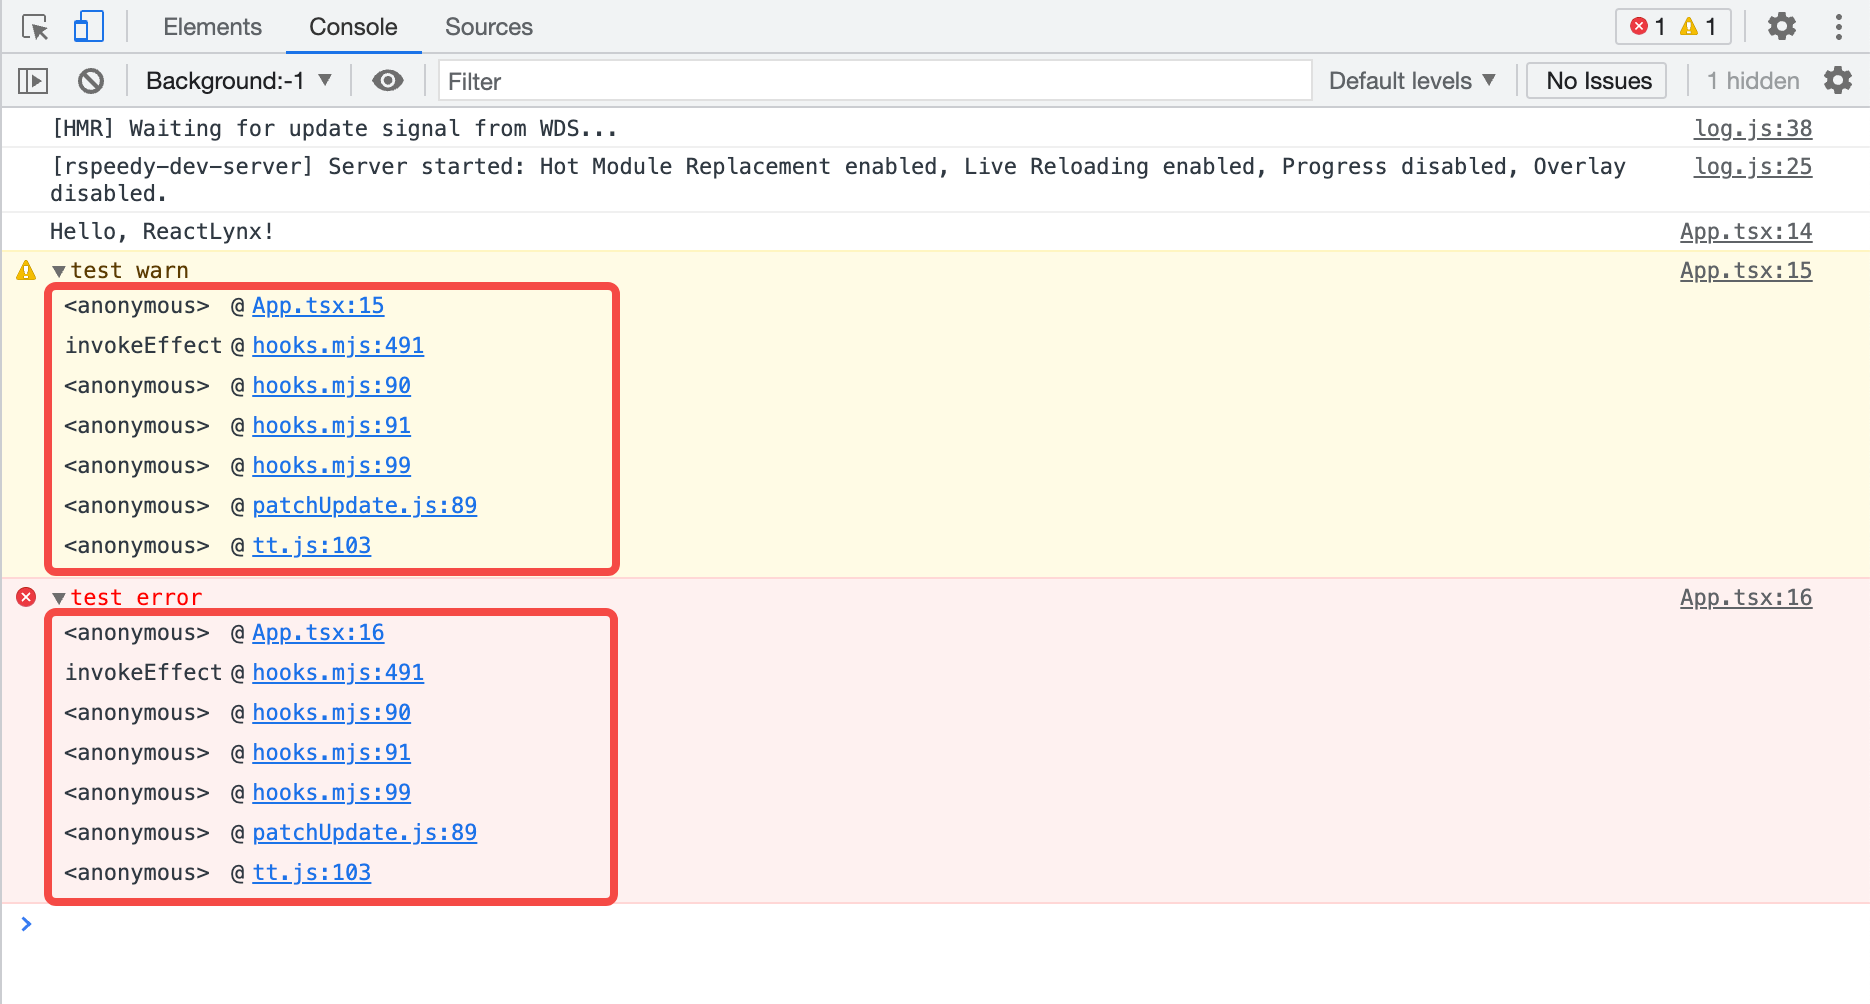
Filter messages
Filter by Log Level
Please refer to Filter by log level | Chrome DevTools.
When the sidebar is open, you cannot click the log level drop-down.
Filter by Text
Please refer to Filter by text | Chrome DevTools.
Filter by Regular Expressions
Please refer to Filter by regular expression | Chrome DevTools.
Filter by URL
Please refer to Filter messages by URL | Chrome DevTools.
Filter Messages from Different Contexts
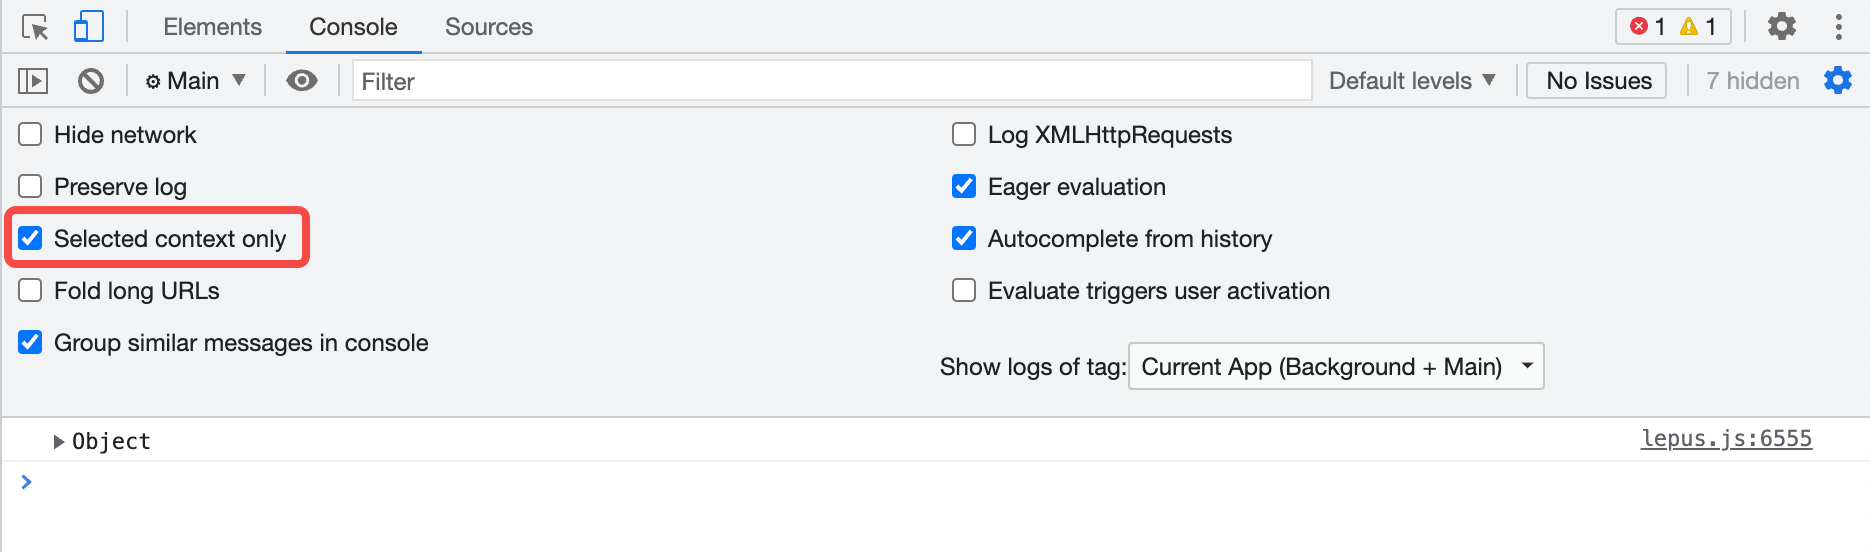
By default, all logs are displayed within the context of the background thread. When Main thread debugging is enabled, an additional context of the main thread will be added.
As shown in the figure, Background:-1 represents the background thread, and Main represents the main thread.

When you run JavaScript in the Console, it will execute only within the currently selected context.
Open Console Settings and enable Selected context only checkbox to display logs only from the currently selected context.
Search for Text
Please refer to Search for text in logs | Chrome DevTools.
Run JavaScript
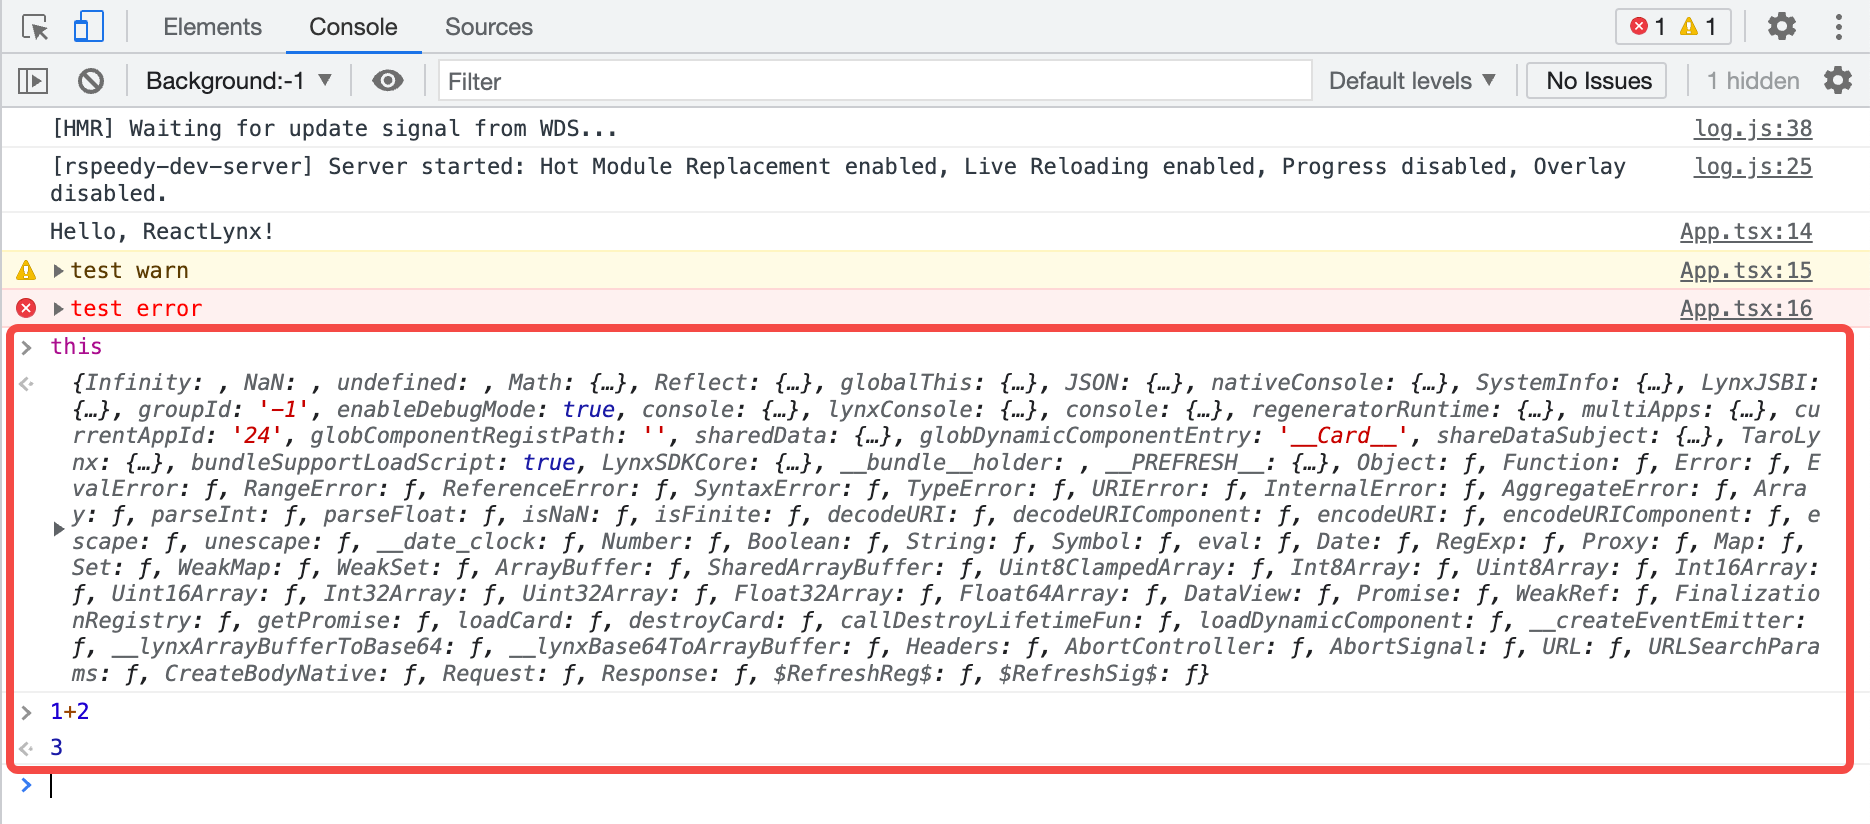
The Console is a REPL, which stands for "Read, Evaluate, Print, and Loop." It reads the JavaScript you enter, evaluates your code, outputs the result of the expression, and then loops back to the first step.
You can enter expressions related to the current page in the Console, such as this.
You can also enter expressions unrelated to the current page, such as 1+2.
Press Enter to get the result, and the Console will output the result of the expression below the code.
String Copy Options
Please refer to String copy options | Chrome DevTools.
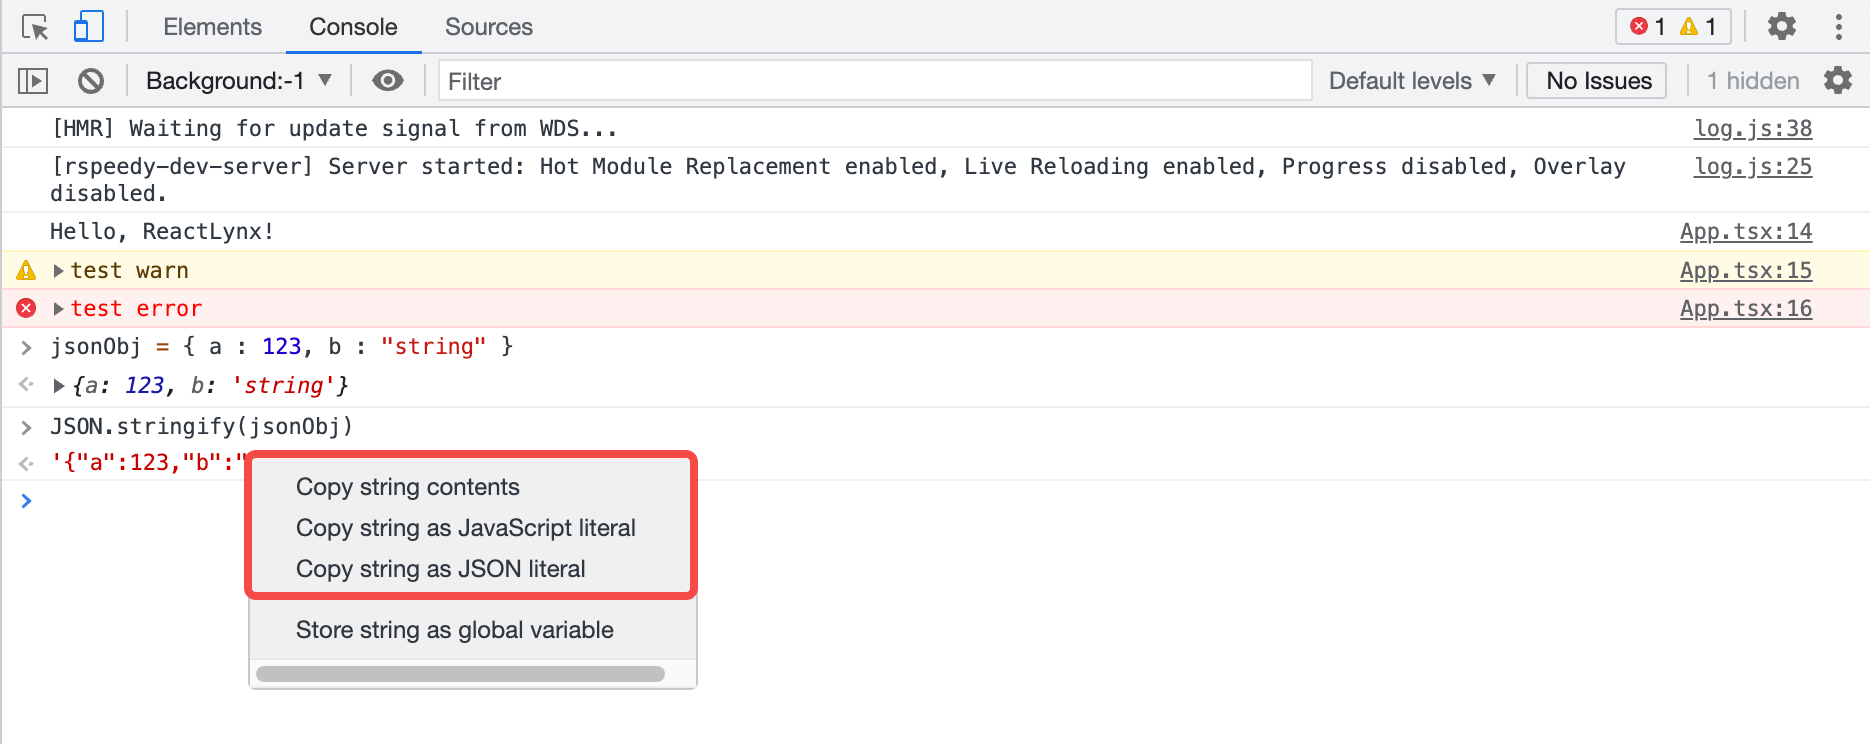
For example, in this case, the results of copying are as follows:
Re-run Expressions from History
Please refer to Re-run expressions from history | Chrome DevTools.
Watch Expression Values in Real-Time
Please refer to Watch JavaScript values in real time with Live Expressions | Chrome DevTools.
Disable Eager Evaluation
Please refer to Disable Eager Evaluation | Chrome DevTools.
Disable Autocomplete from History
Please refer to Disable autocomplete from history | Chrome DevTools.
Clear the Console
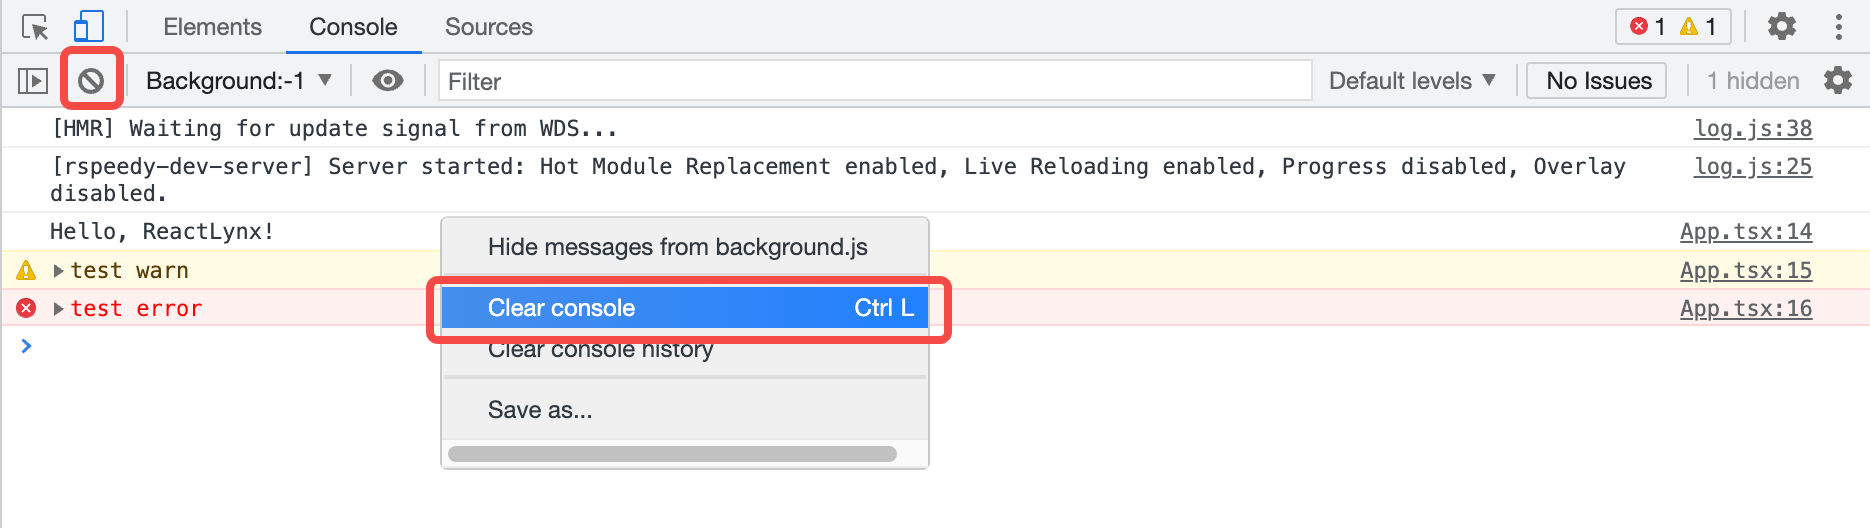
You can use any of the following workflows to clear the Console:
-
Click Clear Console
 .
. - Right-click a log and select Clear Console.
- When the Console is in focus, press Control+L or Command+K.
Compatibility
LCD tables only load in the browser