

Track Overview
What is a Track
In the Trace UI, a Track is the basic unit that displays Trace data. Each Track represents a type of events or data stream, such as thread activity, CPU frequency, memory changes, and key timing markers. Tracks let developers clearly see the occurrence order, duration, and distribution across threads on a timeline, enabling analysis of application behavior and performance bottlenecks. A Track is shown as a horizontal bar in the Trace UI, with its name displayed on the left.
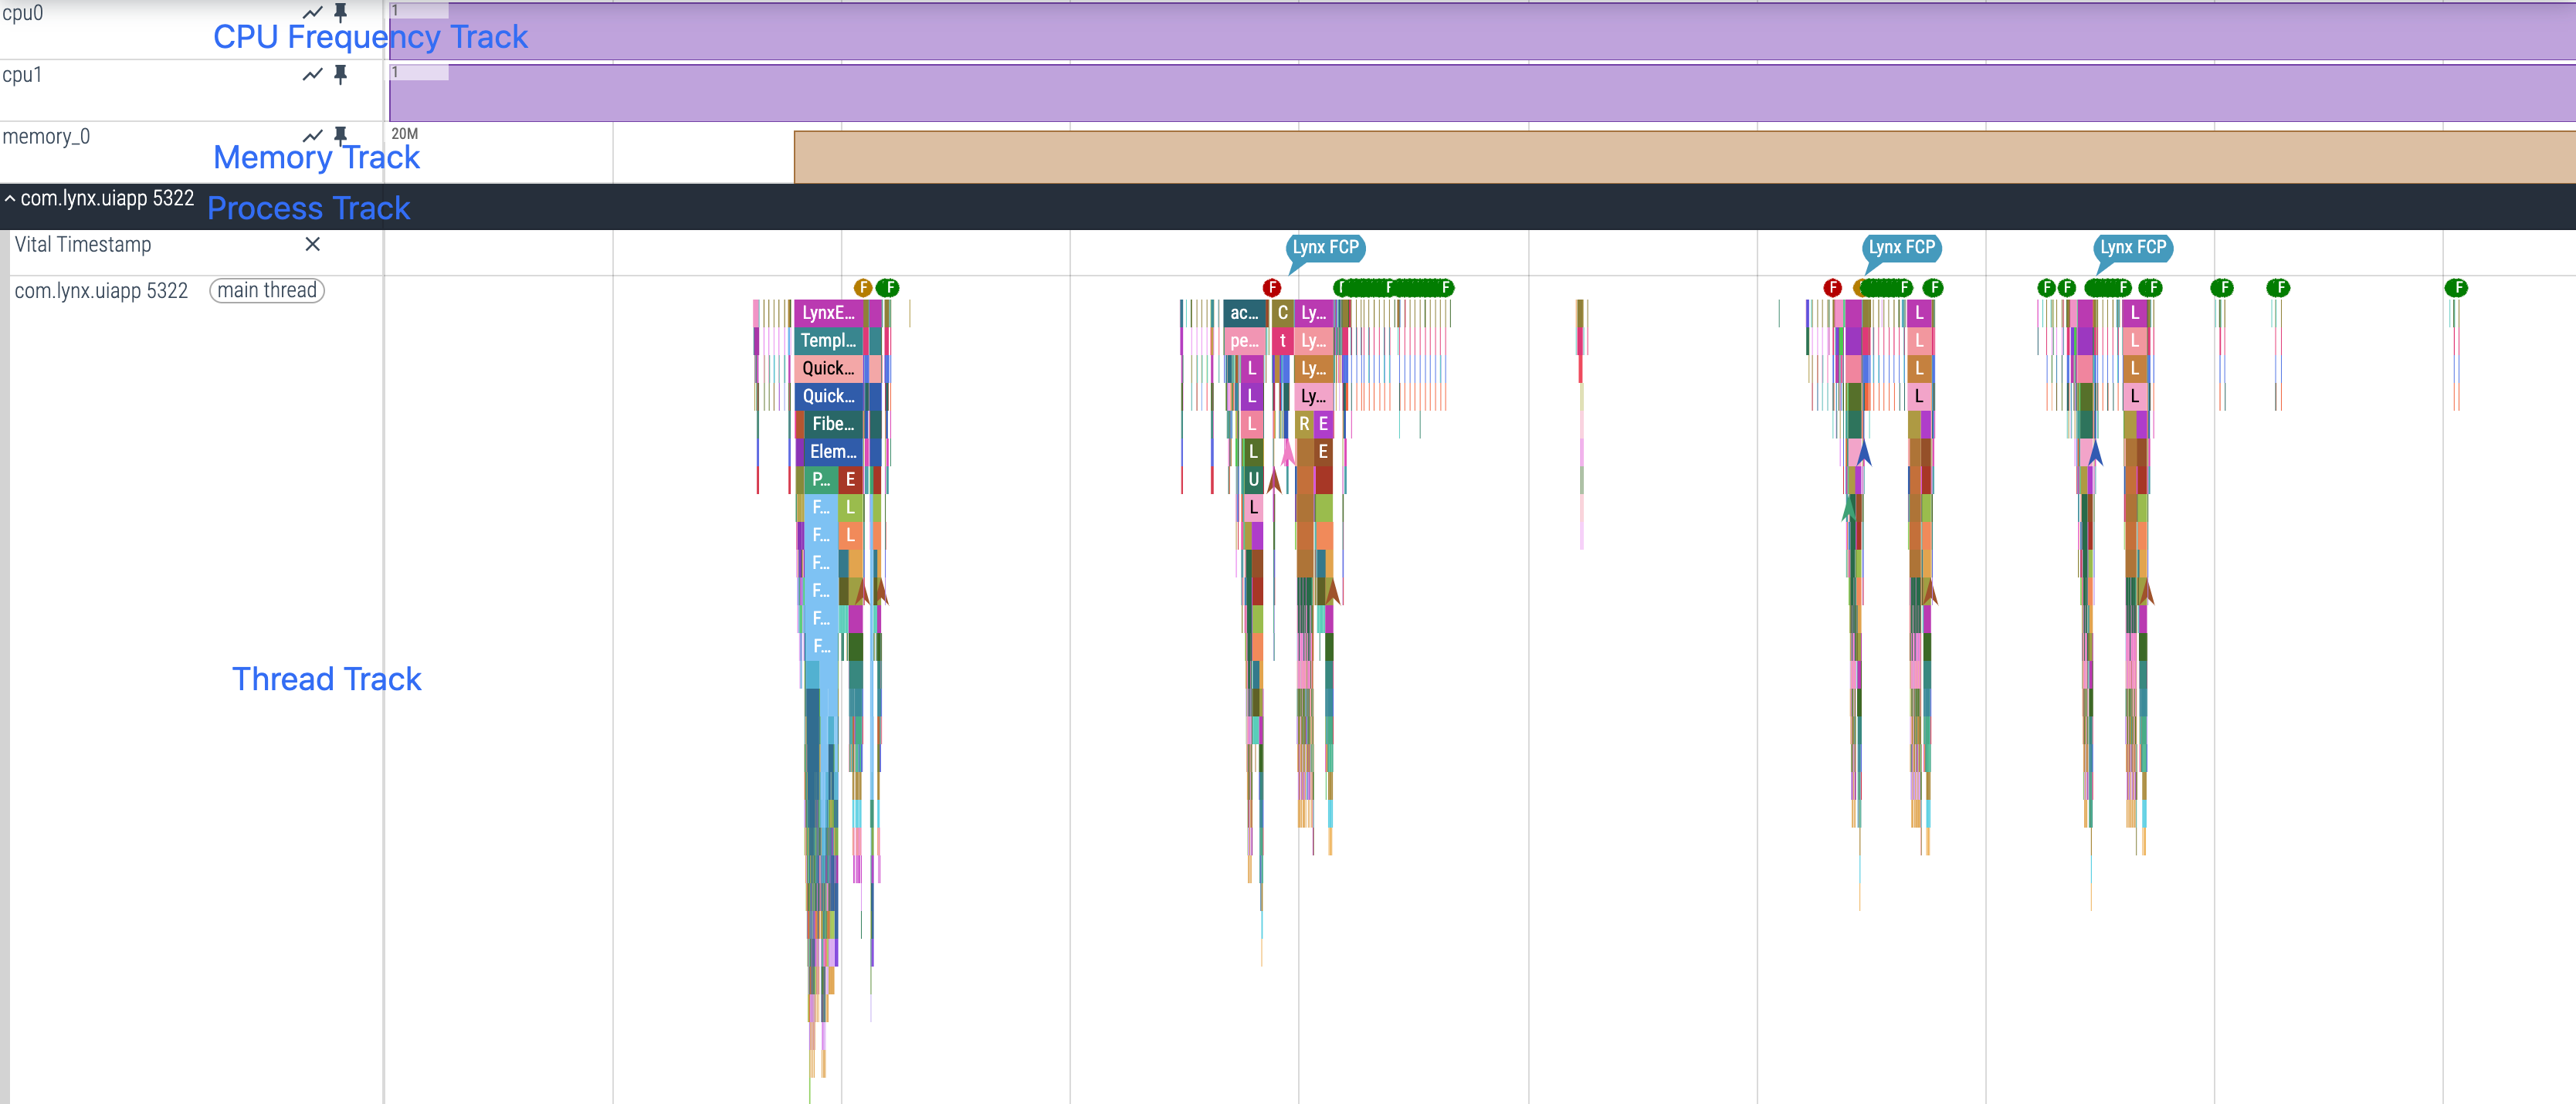
Common Tracks
Process Track
The Process Track is typically named using the process name and process id (iOS and macOS Traces use Process {pid}). In Lynx Trace, there is usually only one Process Track, serving as the top-level container for all other Tracks.
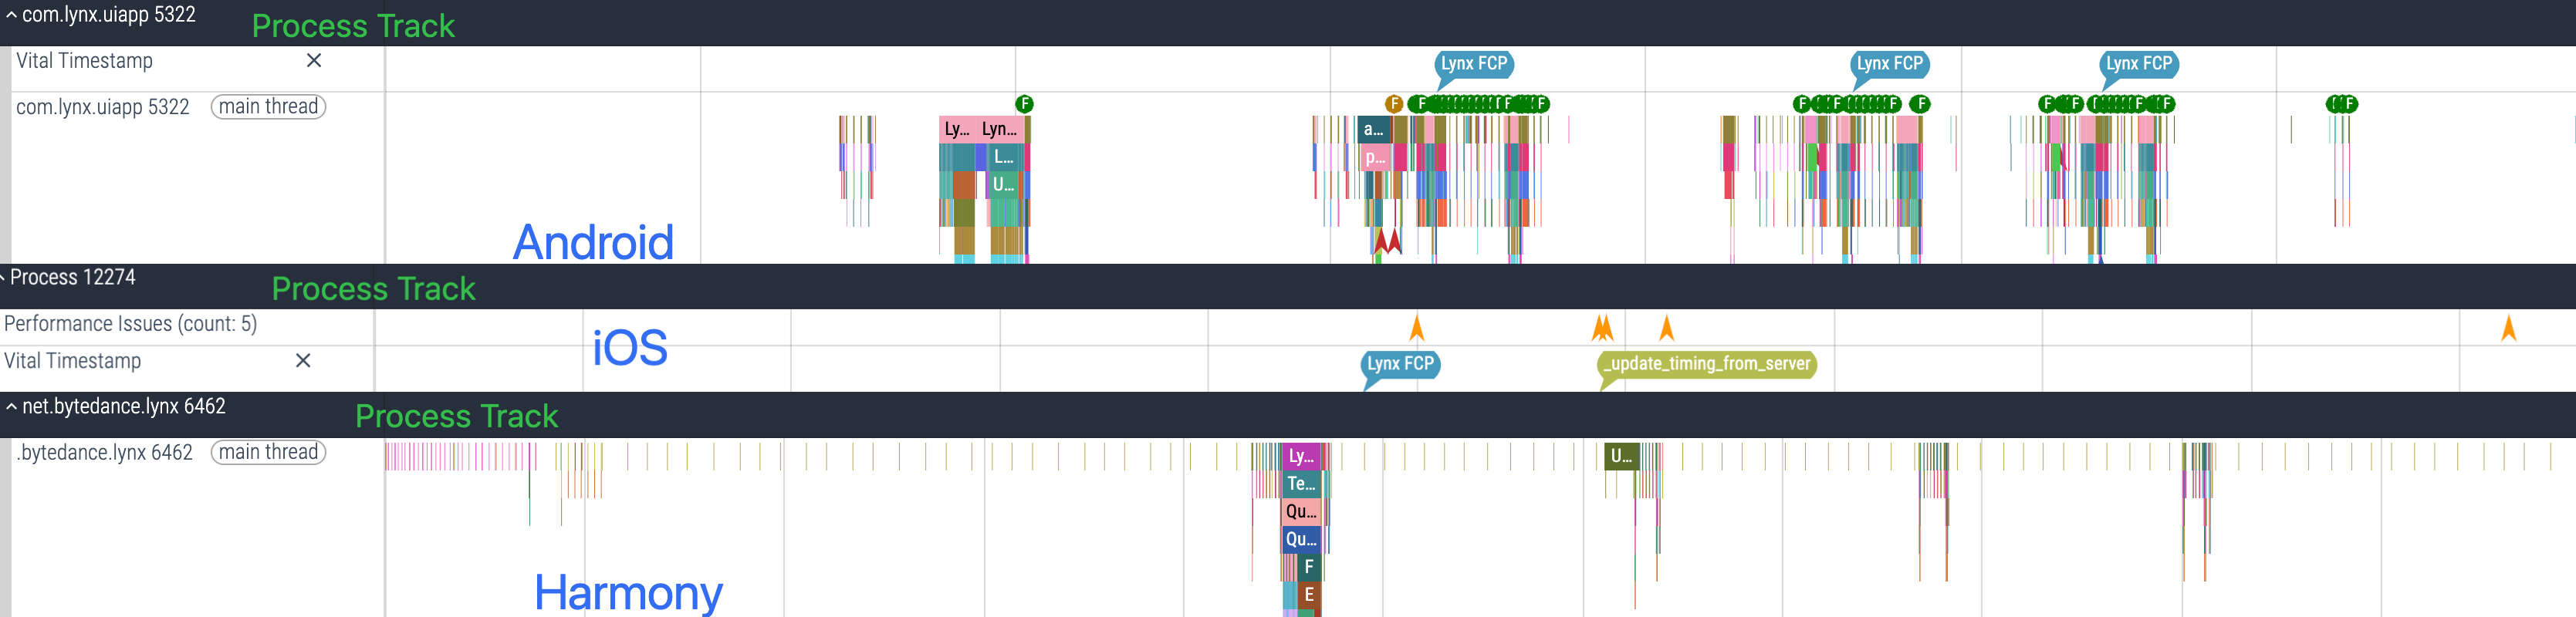
Thread Track
Thread Tracks are typically named using the thread name and thread id. Lynx Trace includes multiple thread Tracks such as the UI thread, Engine thread, and background thread. Below are common Thread Tracks that help developers see the order, duration, and thread distribution of events to analyze behavior and bottlenecks.
UI Thread Track
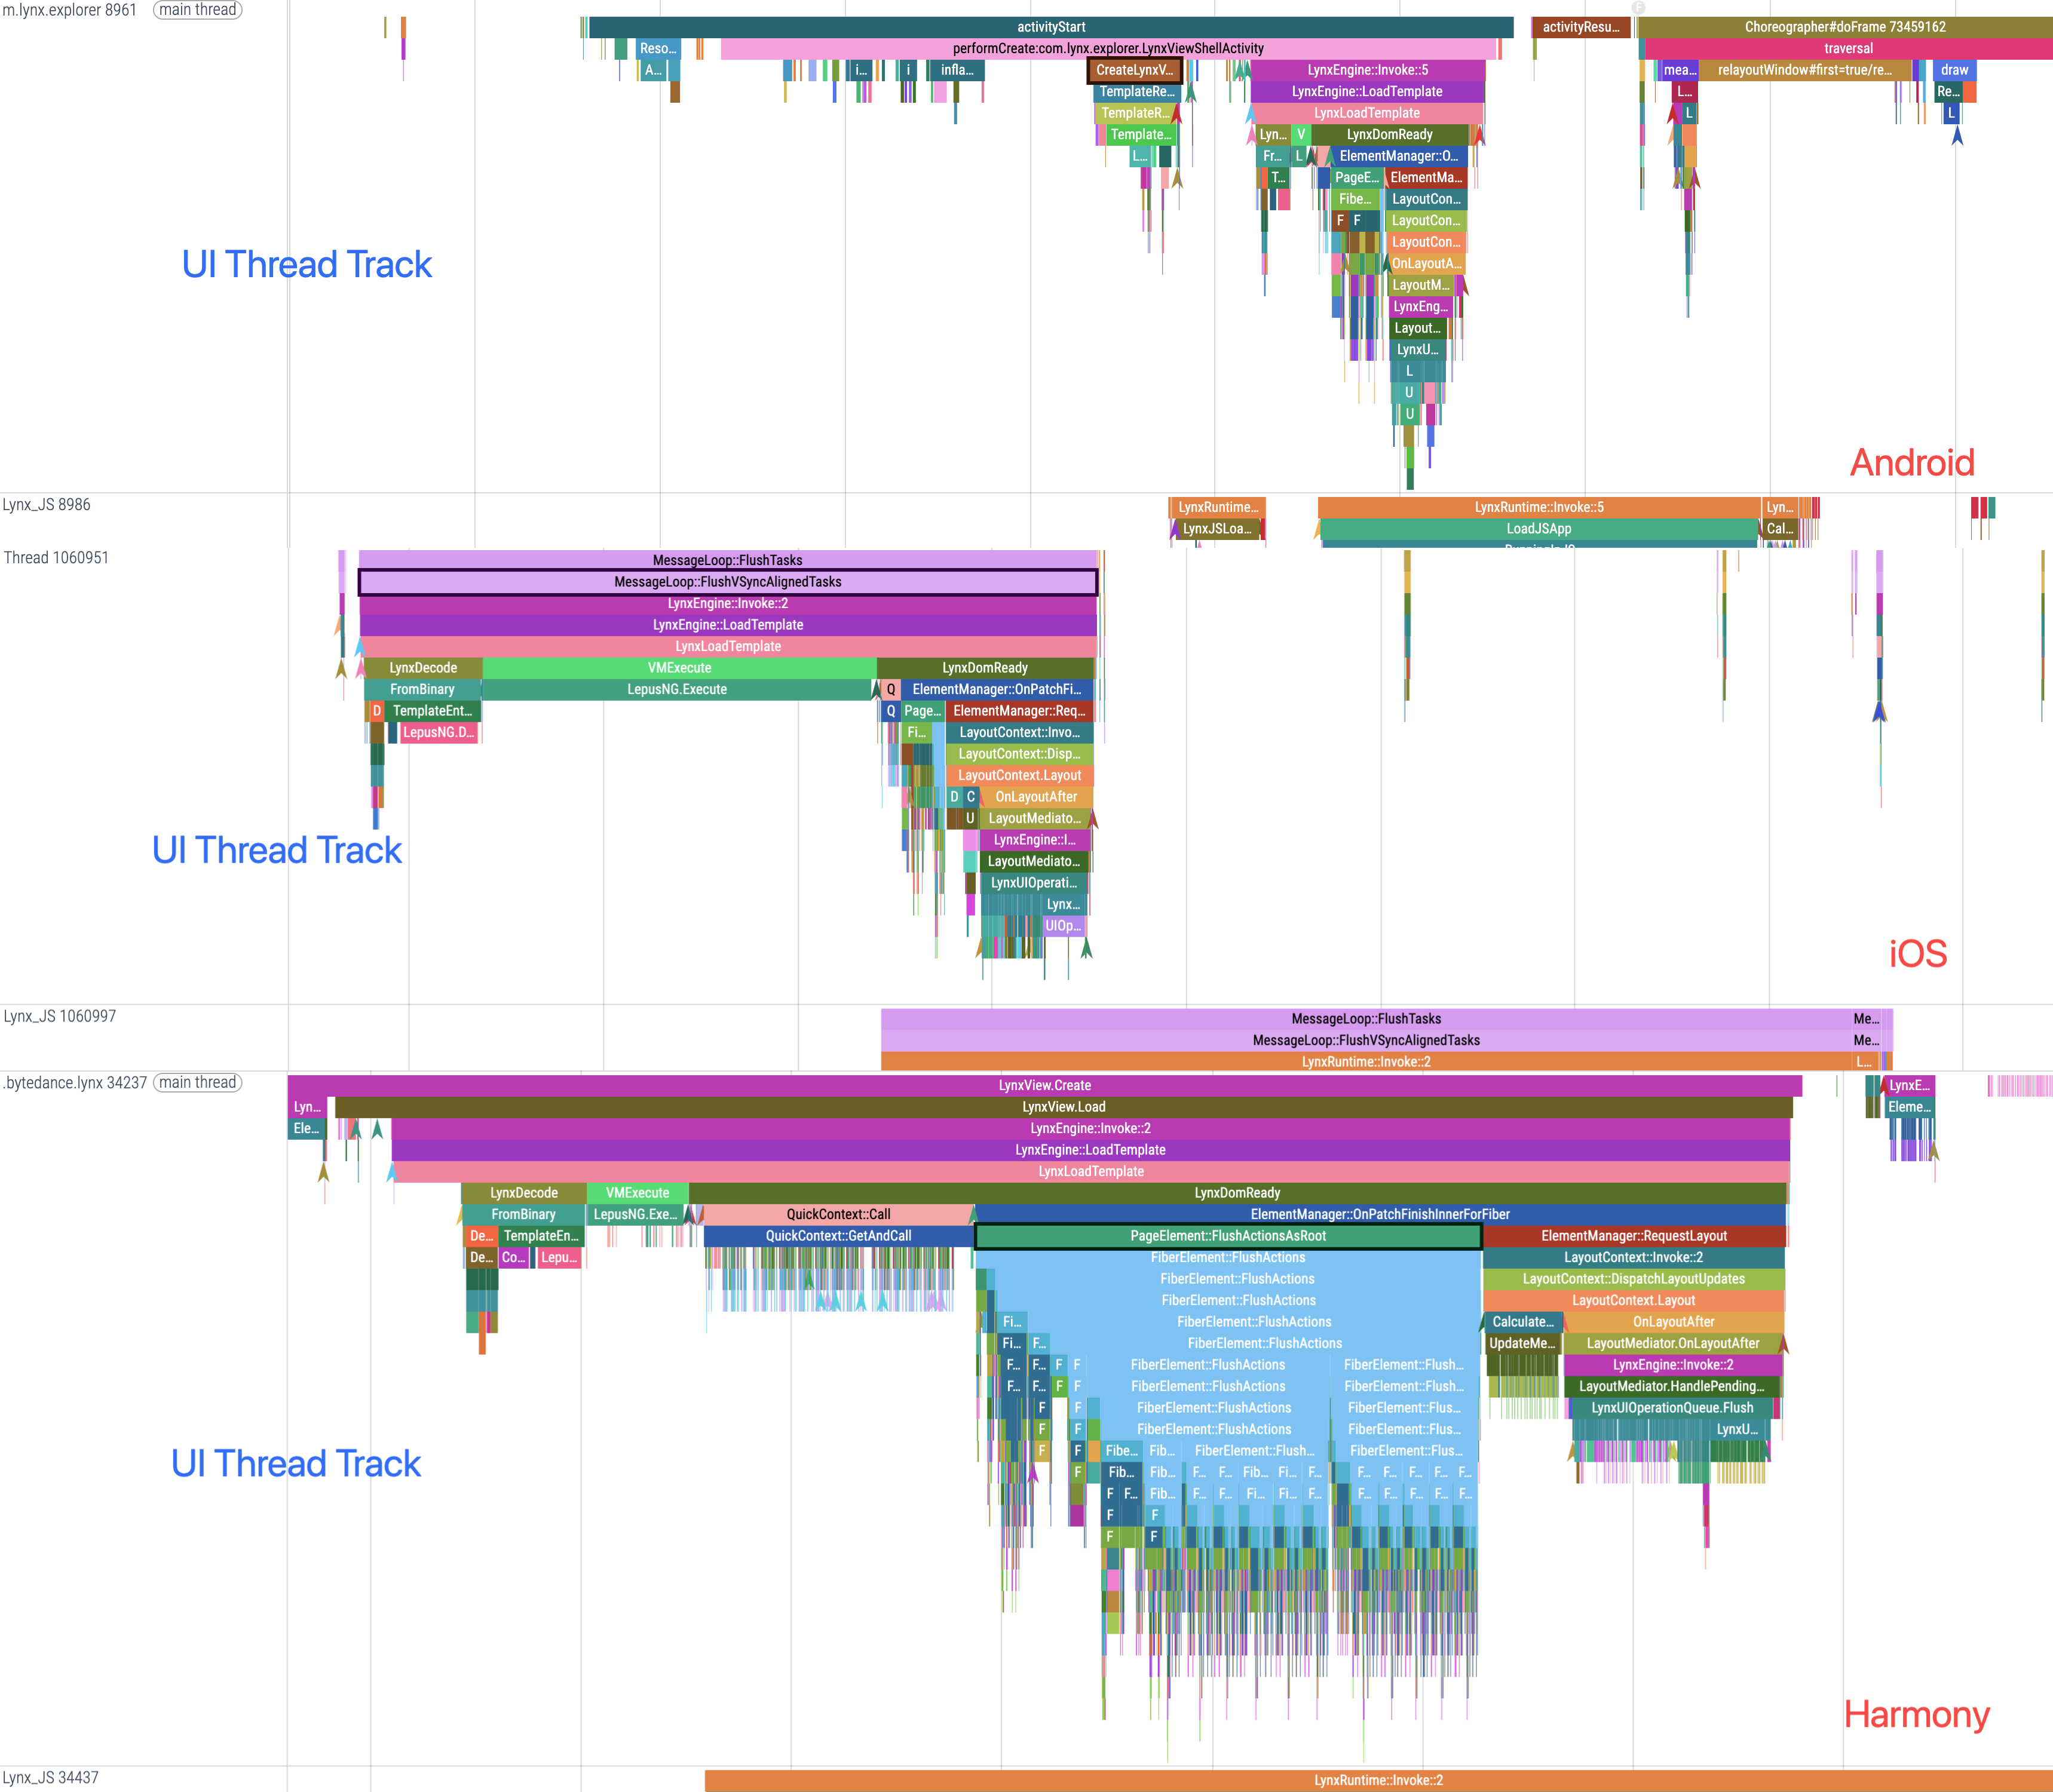
The UI Thread Track shows all events and tasks on the application’s UI thread, such as page rendering, UI operations, and the main loop. Analyzing the UI Thread Track helps locate performance issues like UI stutter and render blocking. In Lynx Trace, a process contains a single UI Thread Track.
By default, the top-most Thread Track is the UI Thread Track.
- On Android and Harmony, the UI Thread Track is named
process-name pid(main thread). - On iOS and macOS, the Thread Track with the smallest thread id is the UI Thread Track.
Background Thread Track
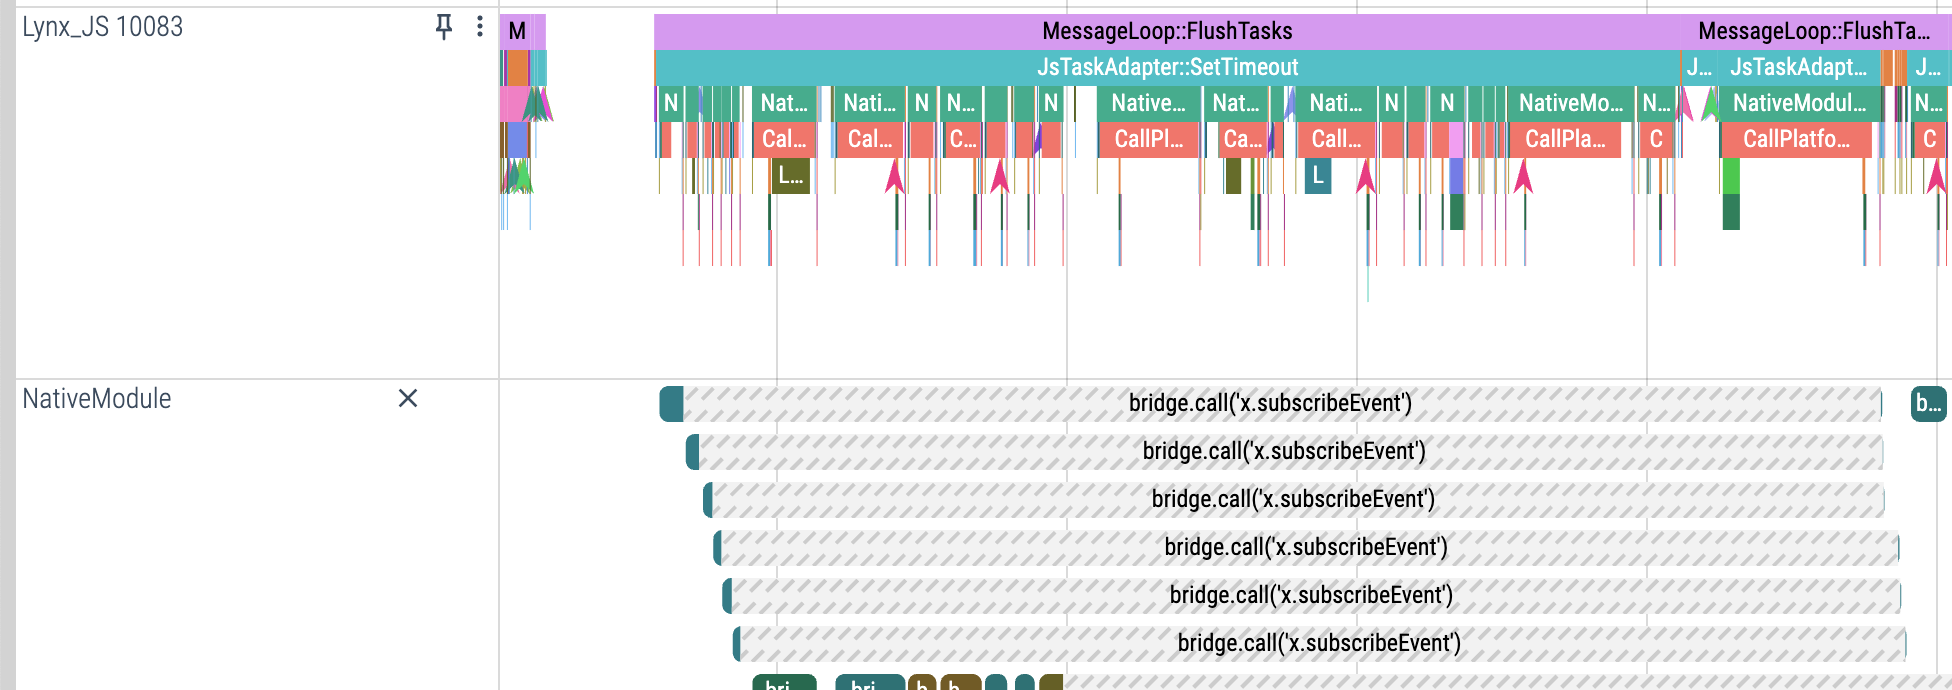
The Background Thread Track shows BTS execution. Use this Track to analyze BTS scheduling, execution, and duration.
For historical reasons, the background thread is named Lynx_JS.

Event Report Track
The Event Report Track shows Lynx’s internal event reporting process, helping locate issues like whether an event was reported.

Performance Issue Track
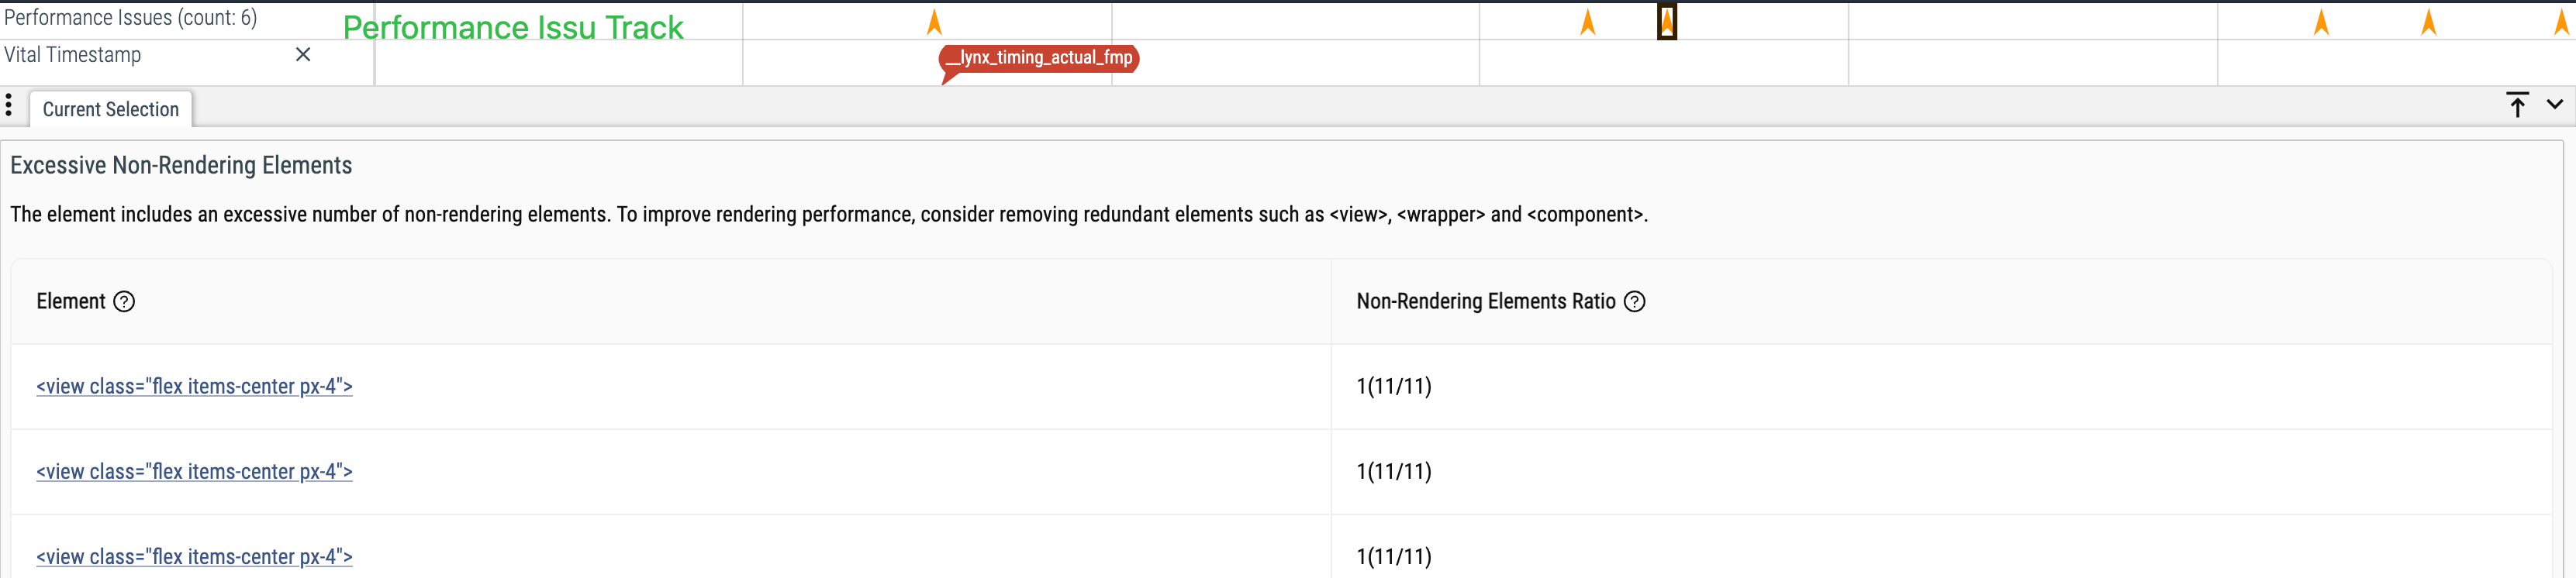
The Performance Issue Track is used to mark performance anomalies and bottlenecks. Developers can quickly locate hot spots and abnormal behavior via this Track.
Timing Track
The Timing Track shows key timestamps (such as first screen render done and actual first meaningful paint), helping developers locate key milestones.

NativeModule Track
The NativeModule Track shows the NativeModule invocation process, including JS–Native communication and data conversion. Use it to analyze native module flows and performance bottlenecks.
CPU Frequency Track
The CPU Frequency Track displays changes in CPU frequency over time as a line chart, helping developers analyze CPU resource usage under high load.

Memory Track
The Memory Track shows Lynx page memory usage changes over time, with each Memory Track representing one Lynx page. Use it to analyze memory leaks, peaks, and abnormal growth.

Common Track operations
Pin Track
Pin Track fixes a Track at the top of the Trace view for easier comparison and continuous focus on key threads or events.

Delete Track
Delete Track lets developers temporarily hide Tracks that are not of interest, simplifying the UI and leaving only the Tracks needed for analysis to improve efficiency. Deleted Tracks reappear after refreshing the Trace page.

More resources
For a more detailed guide on Trace Tracks and advanced features, see the official Perfetto documentation: perfetto-ui