Lynx DevTool
Lynx DevTool is a collection of performance and debugging tools for Lynx apps.
Experience Lynx DevTool
Run Lynx Explorer
Please visit Lynx Explorer and follow the documentation to run Lynx Explorer app locally.
Enable Debugging Feature in Lynx Explorer
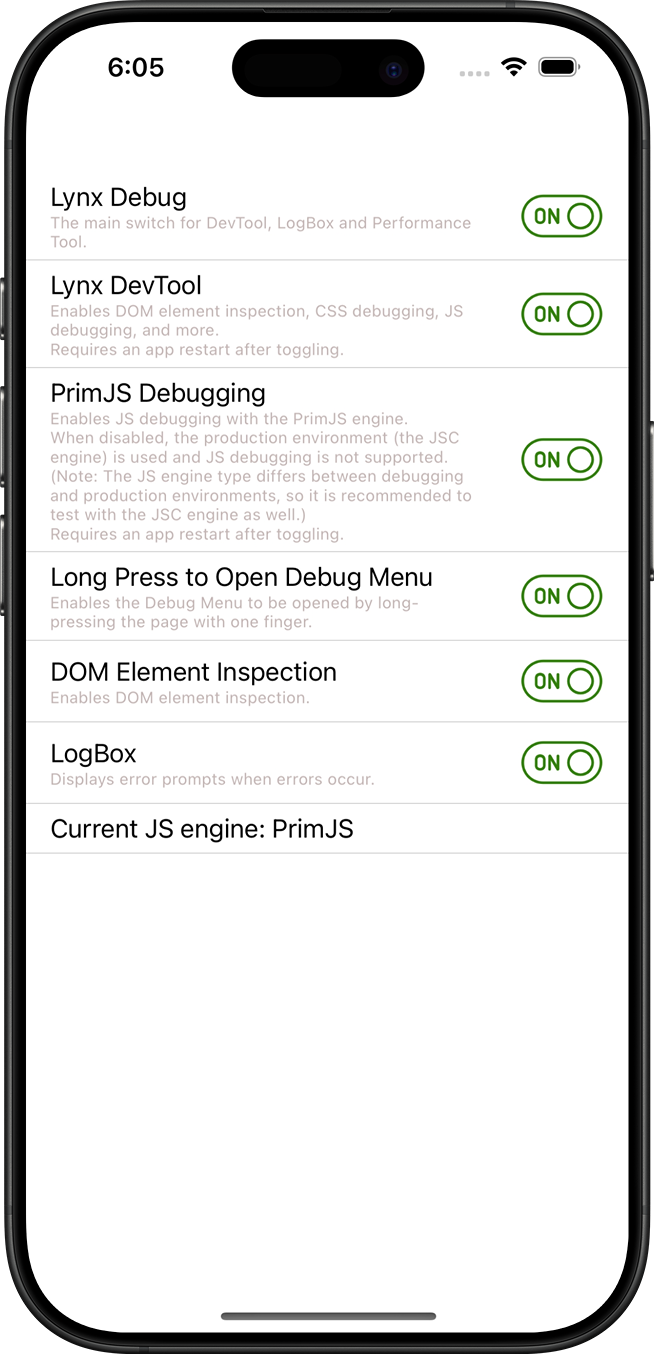
Ensure that the Lynx Debug and Lynx DevTool switches are enabled in the Switch page of Lynx Explorer.
Run Lynx DevTool Desktop Application
You can visit Lynx DevTool to get the latest version of Lynx DevTool desktop application.
Launch Lynx DevTool Desktop Application.
Use Data Cable to Connect Debugging Device
Use a data cable to connect the debugging device, and Lynx DevTool Desktop Application will automatically recognize the debugging device and display the Lynx app information on the debugging device.
View Device Connection Status

In the toolbar, you can view the connection status of the current device.
- USB represents that the device is connected via USB cable.
- Time represents the delay of communication with the device.
Choose Debugging Device

In the toolbar, you can click this button, and select other connected devices from the pop-up menu.
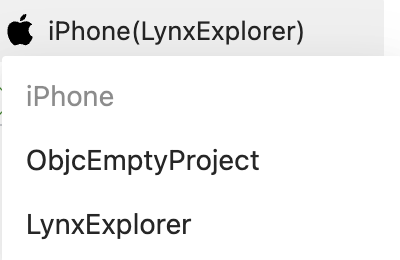
After switching devices, please ensure that the Lynx app on the device is running in the foreground.
Choose Page and Debugging Options

There may be multiple Lynx page instances at the same time in a page. For debugging between different page instances, you need to select the current page instance to be debugged.
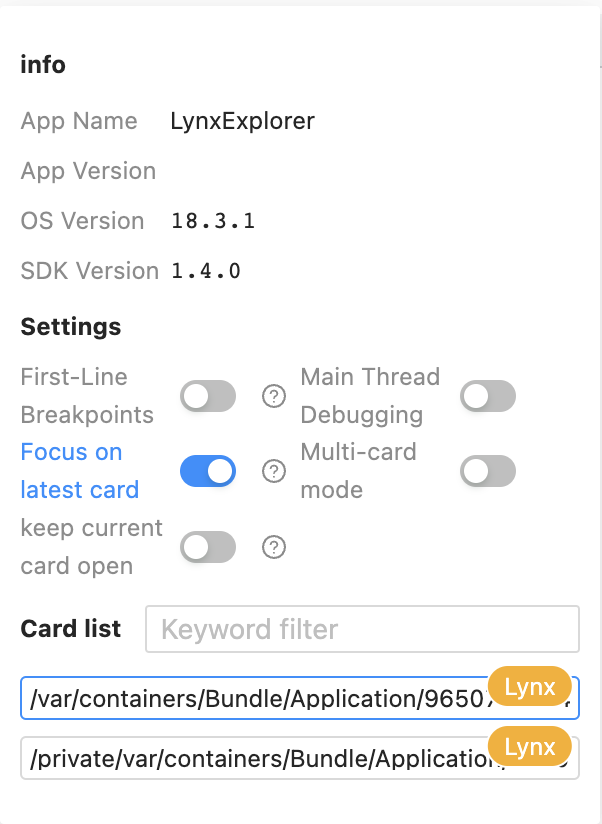
At the bottom of the debugging options page, you can select the page to be debugged. Move the mouse over the page path, and the page thumbnail will be displayed on the right.
In the debugging options menu, there are App Info for displaying application and Lynx information, and Settings for setting debugging options.
Debugging Panels
Dive into the debugging functions.
Elements
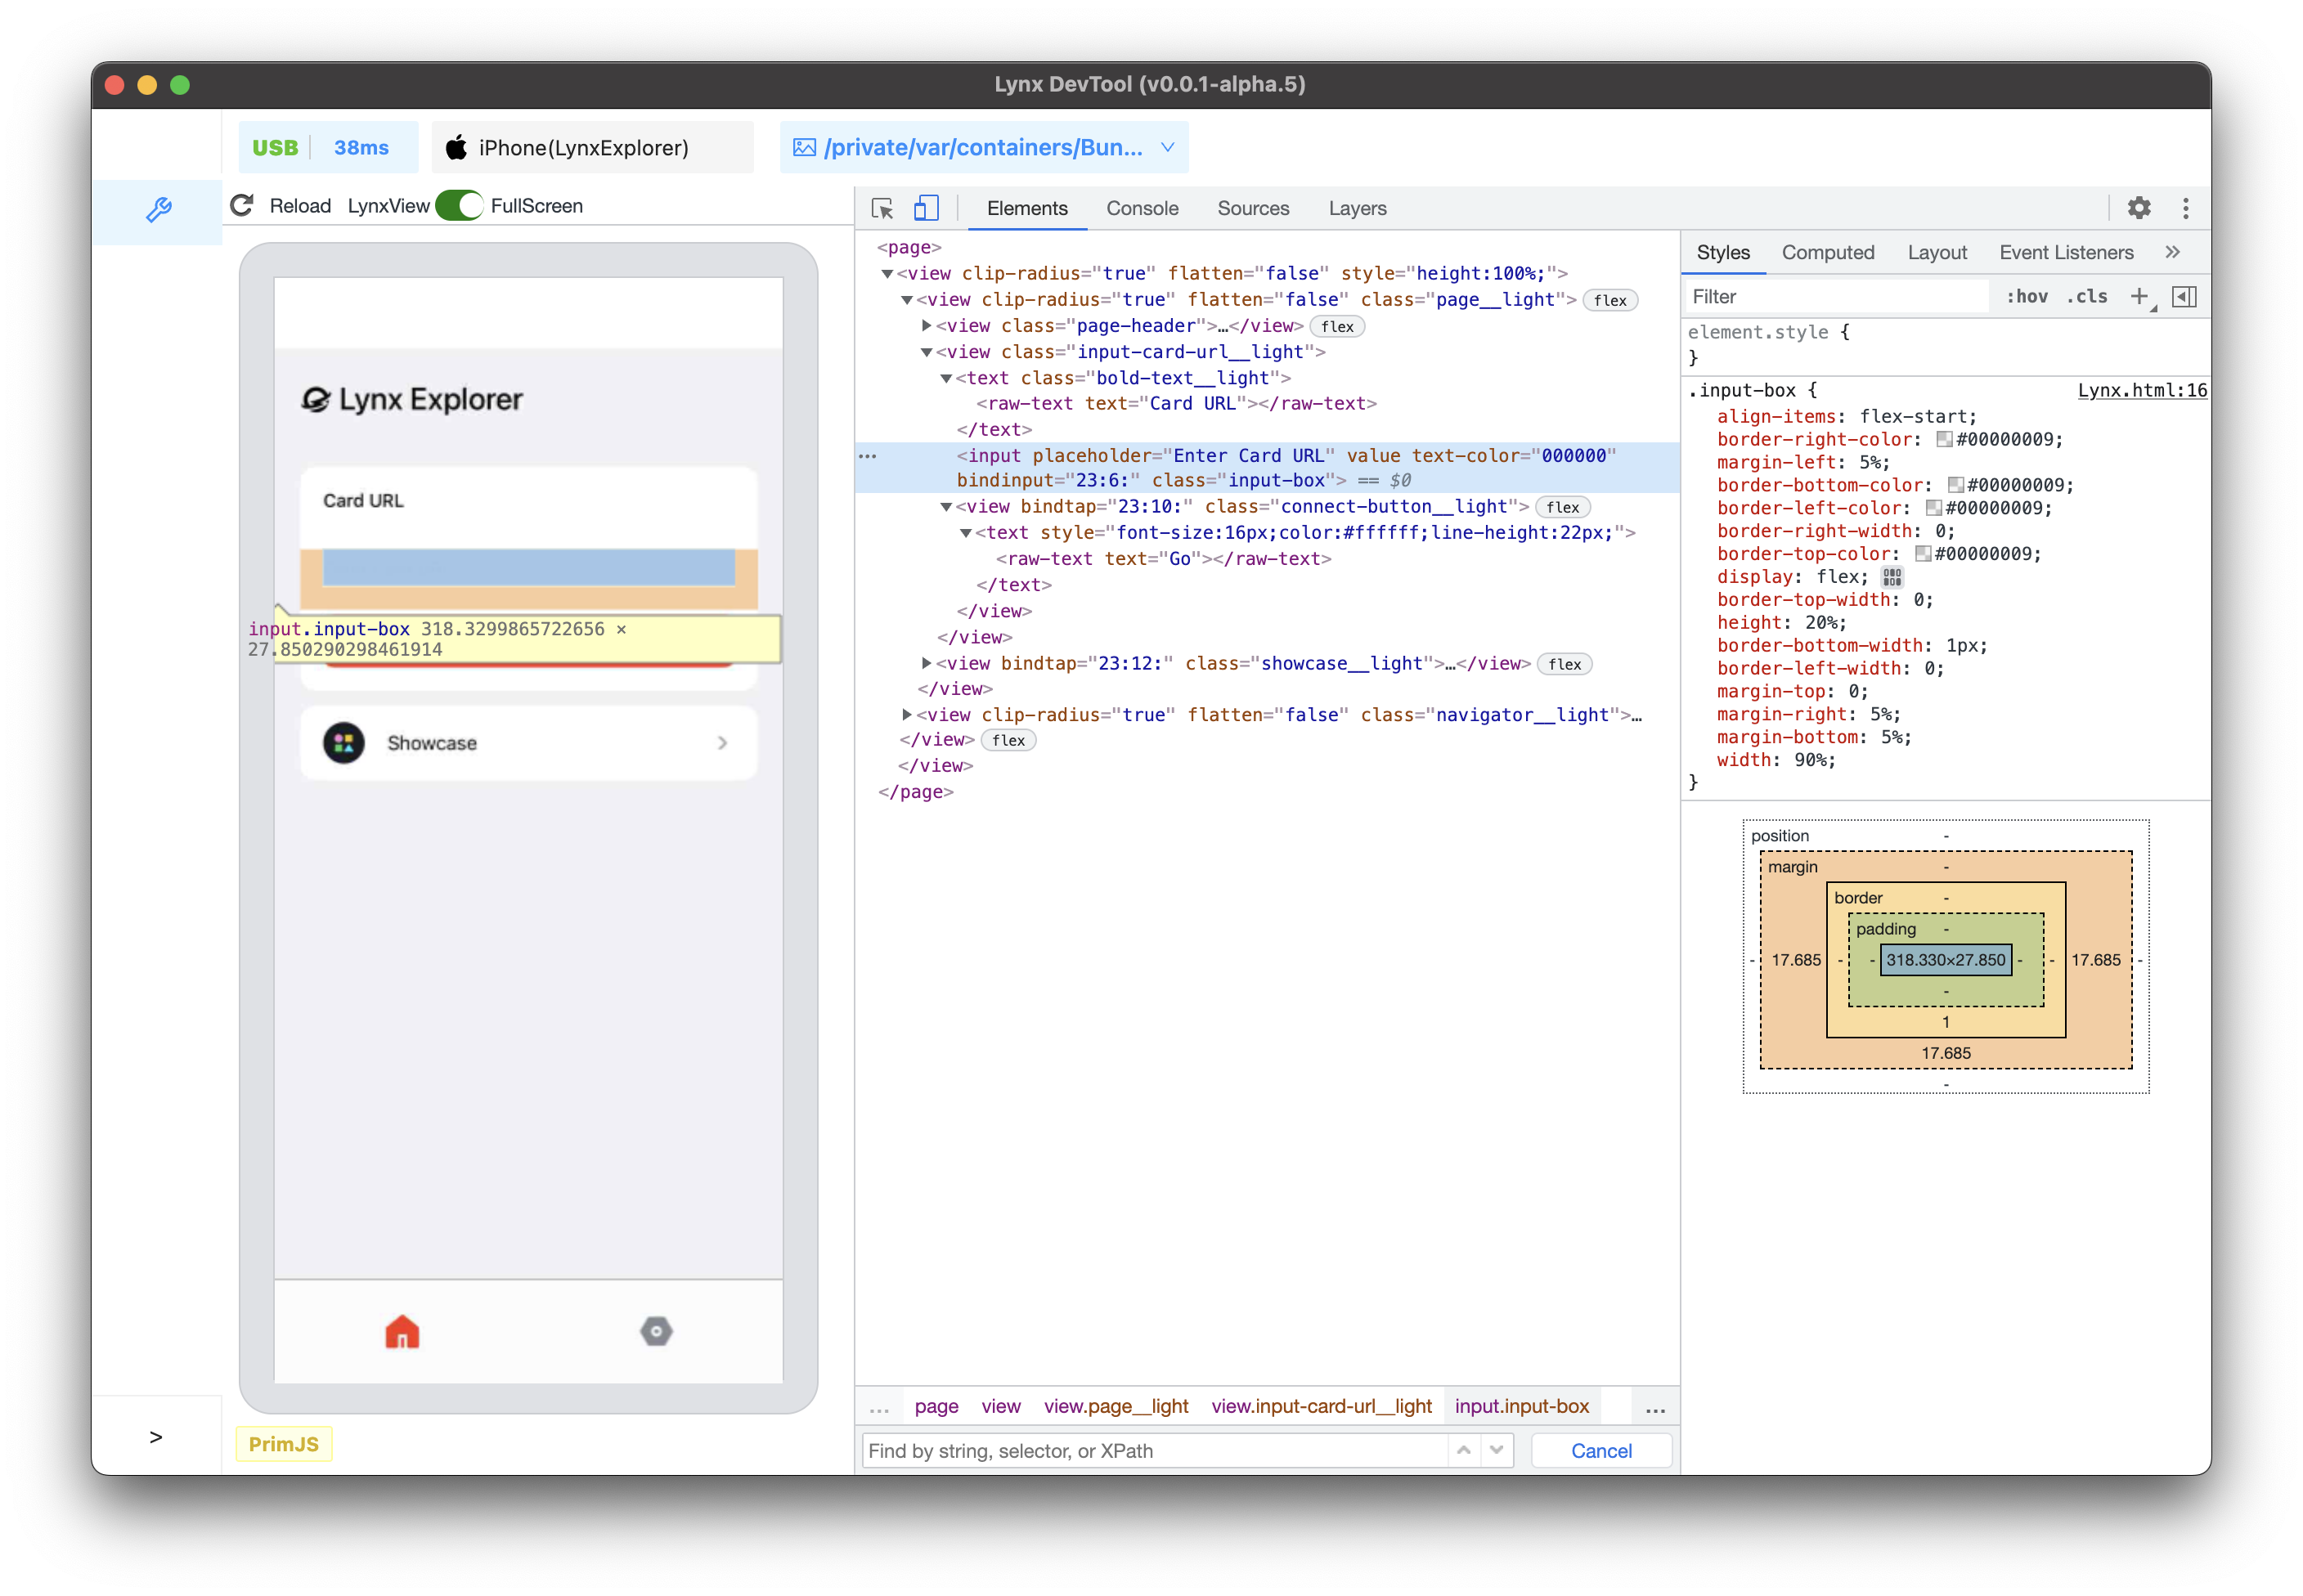
The Elements panel allows you to inspect and modify elements.
Console
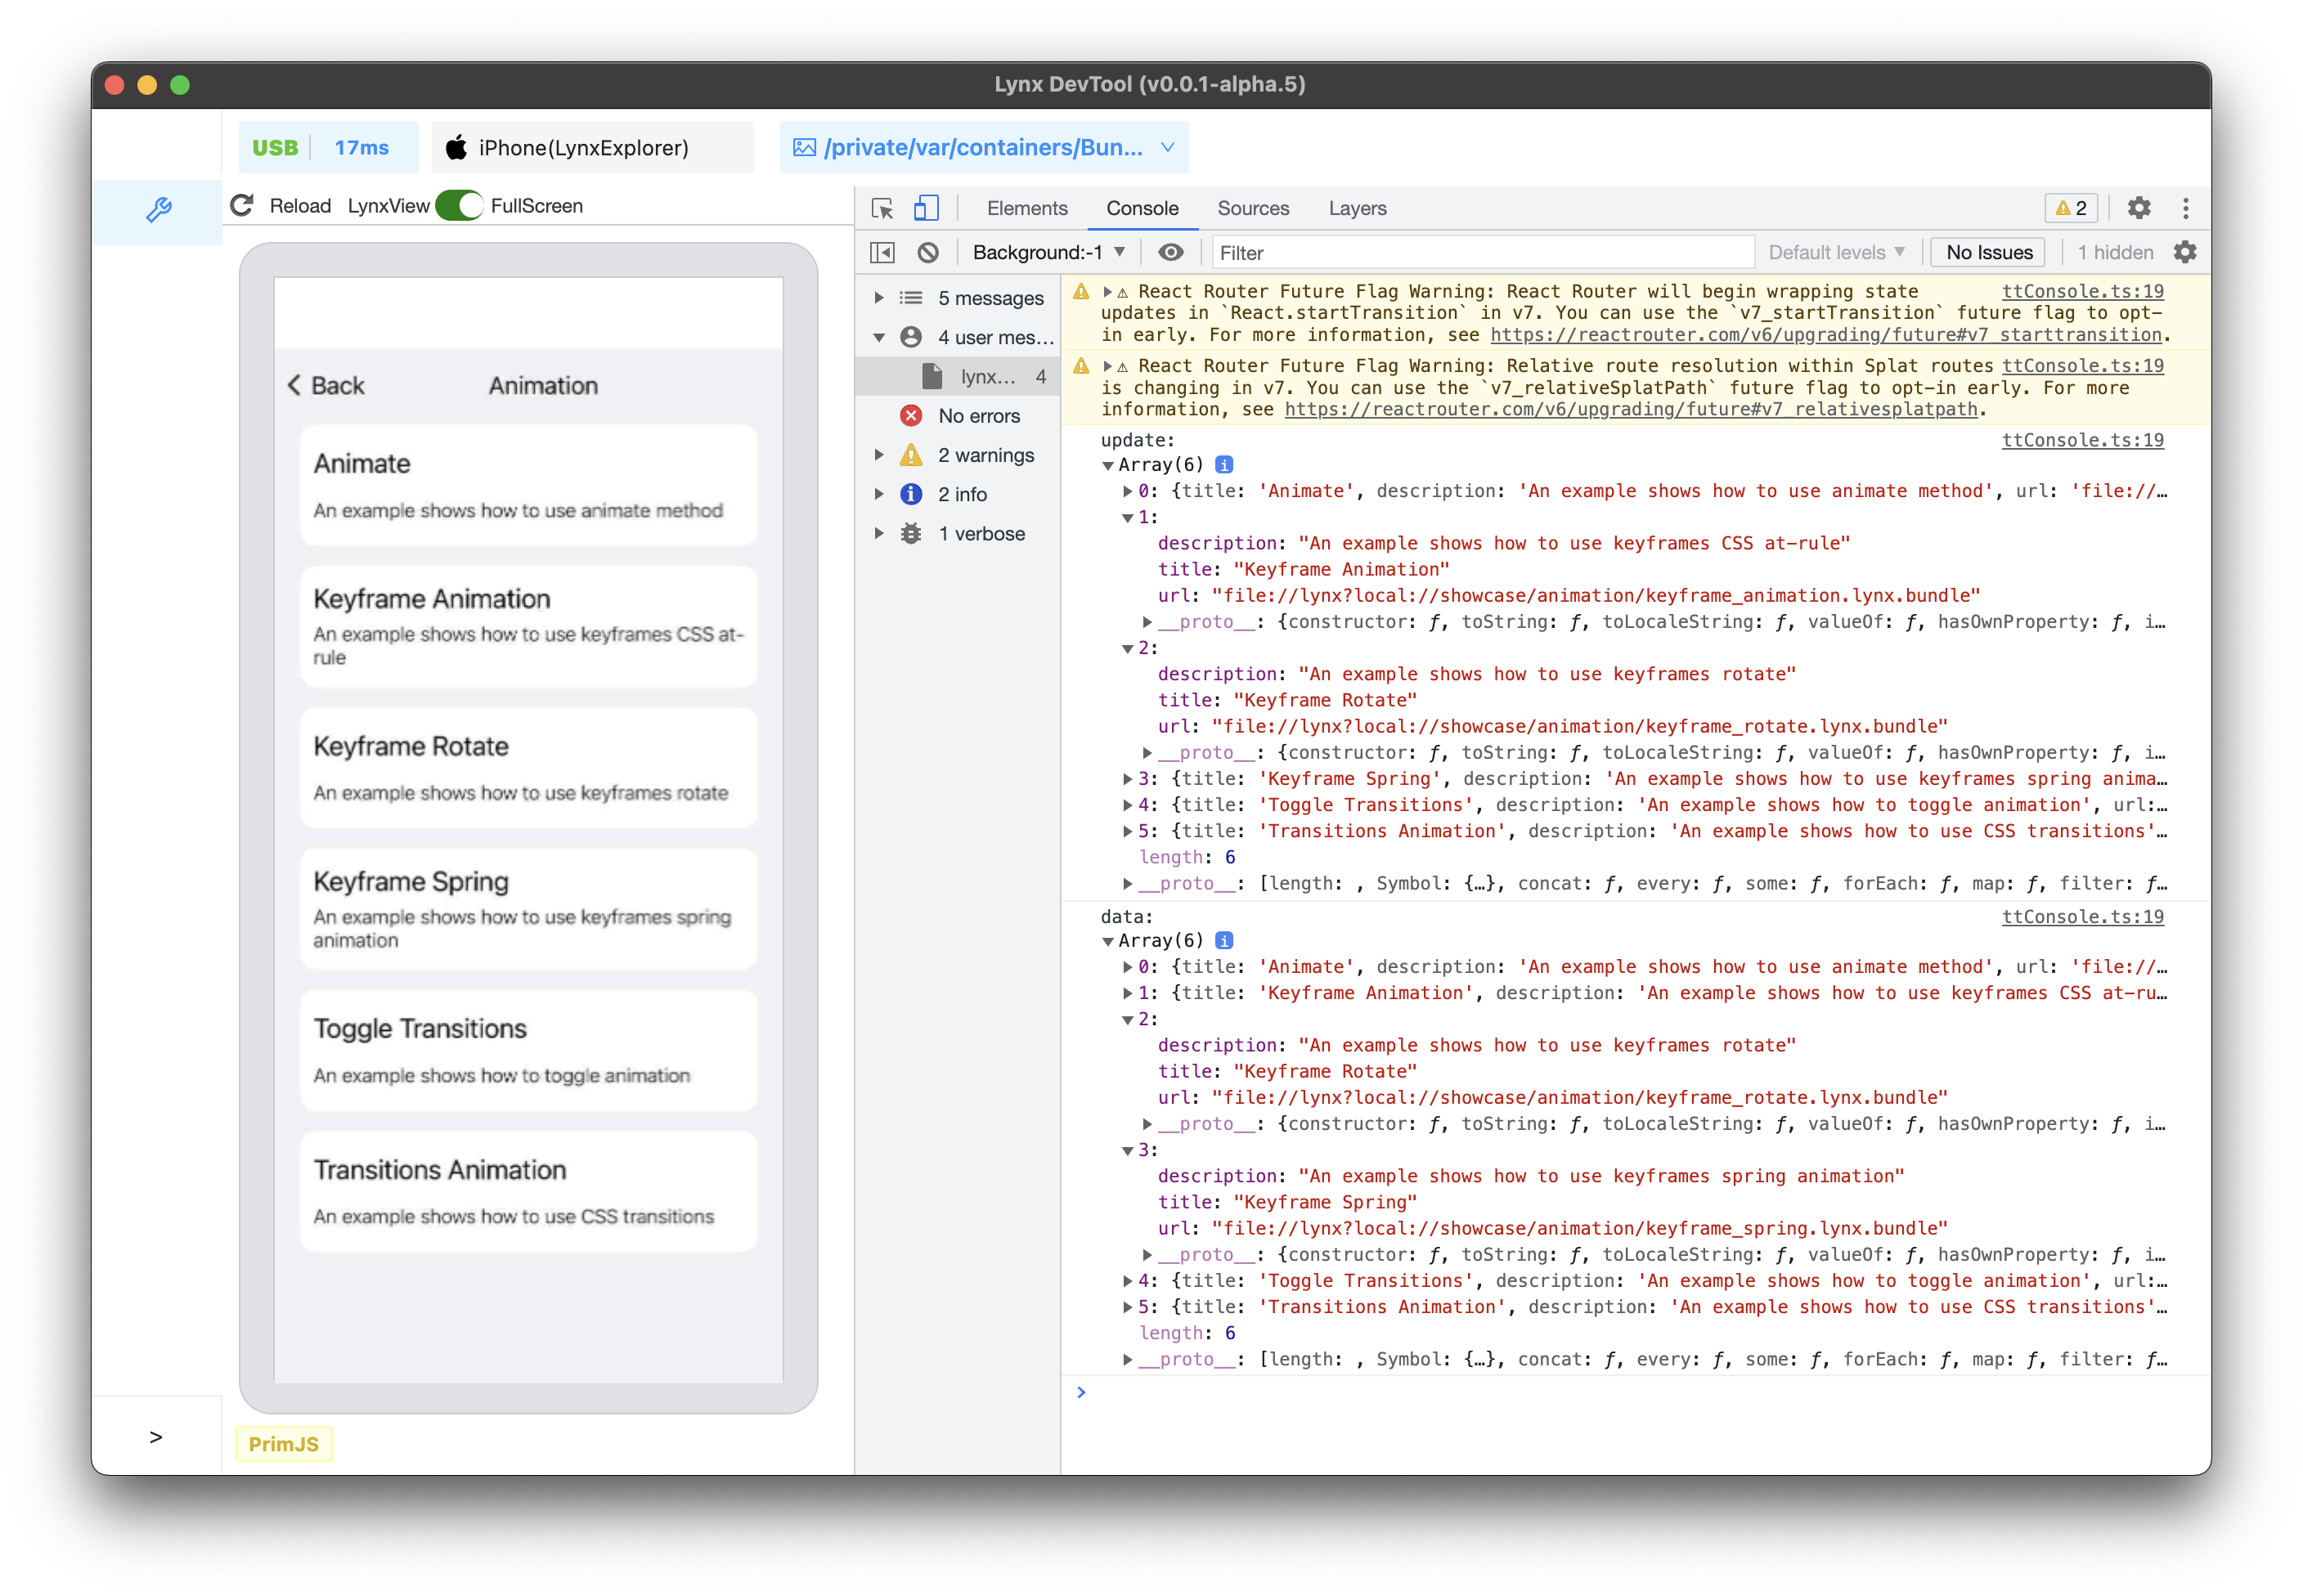
Use the Console panel to view logged messages and run JavaScript.
Sources
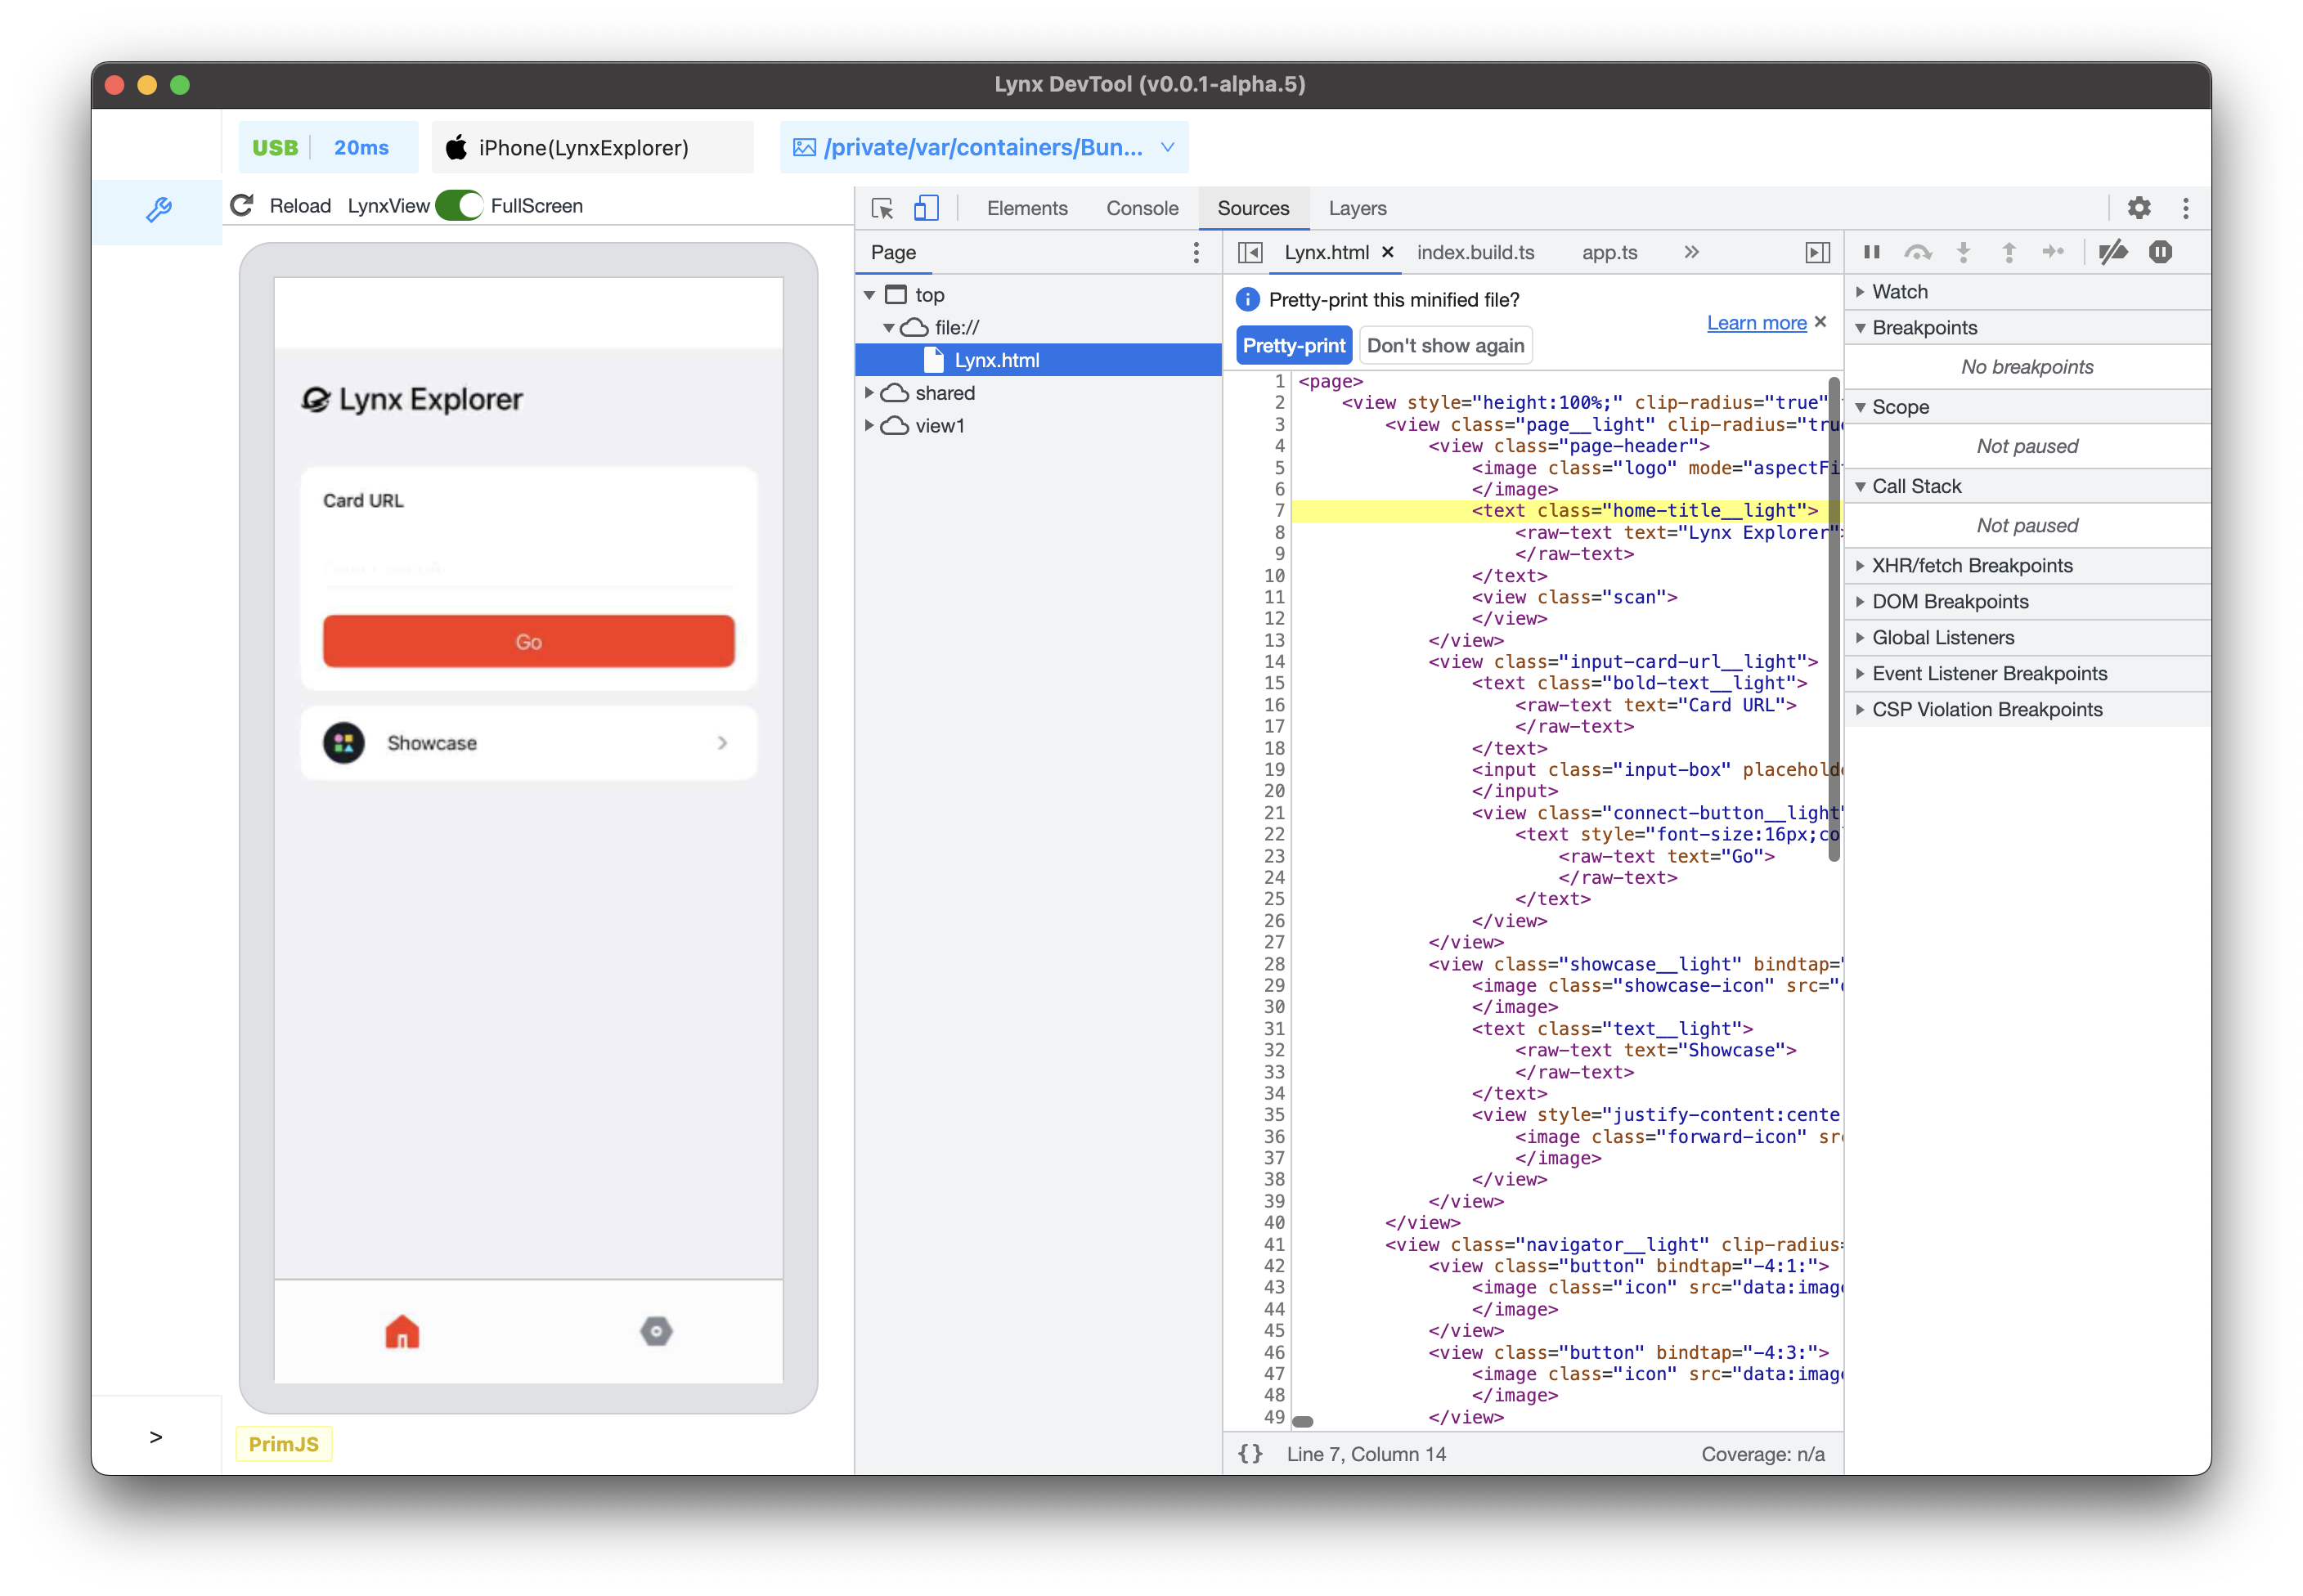
Use the Sources panel to debug JavaScript.
- File Navigation
- Pause Code with Breakpoints
- Debug JavaScript
- Debug Original Code with Source Maps
- Debug the Main Thread
Layers
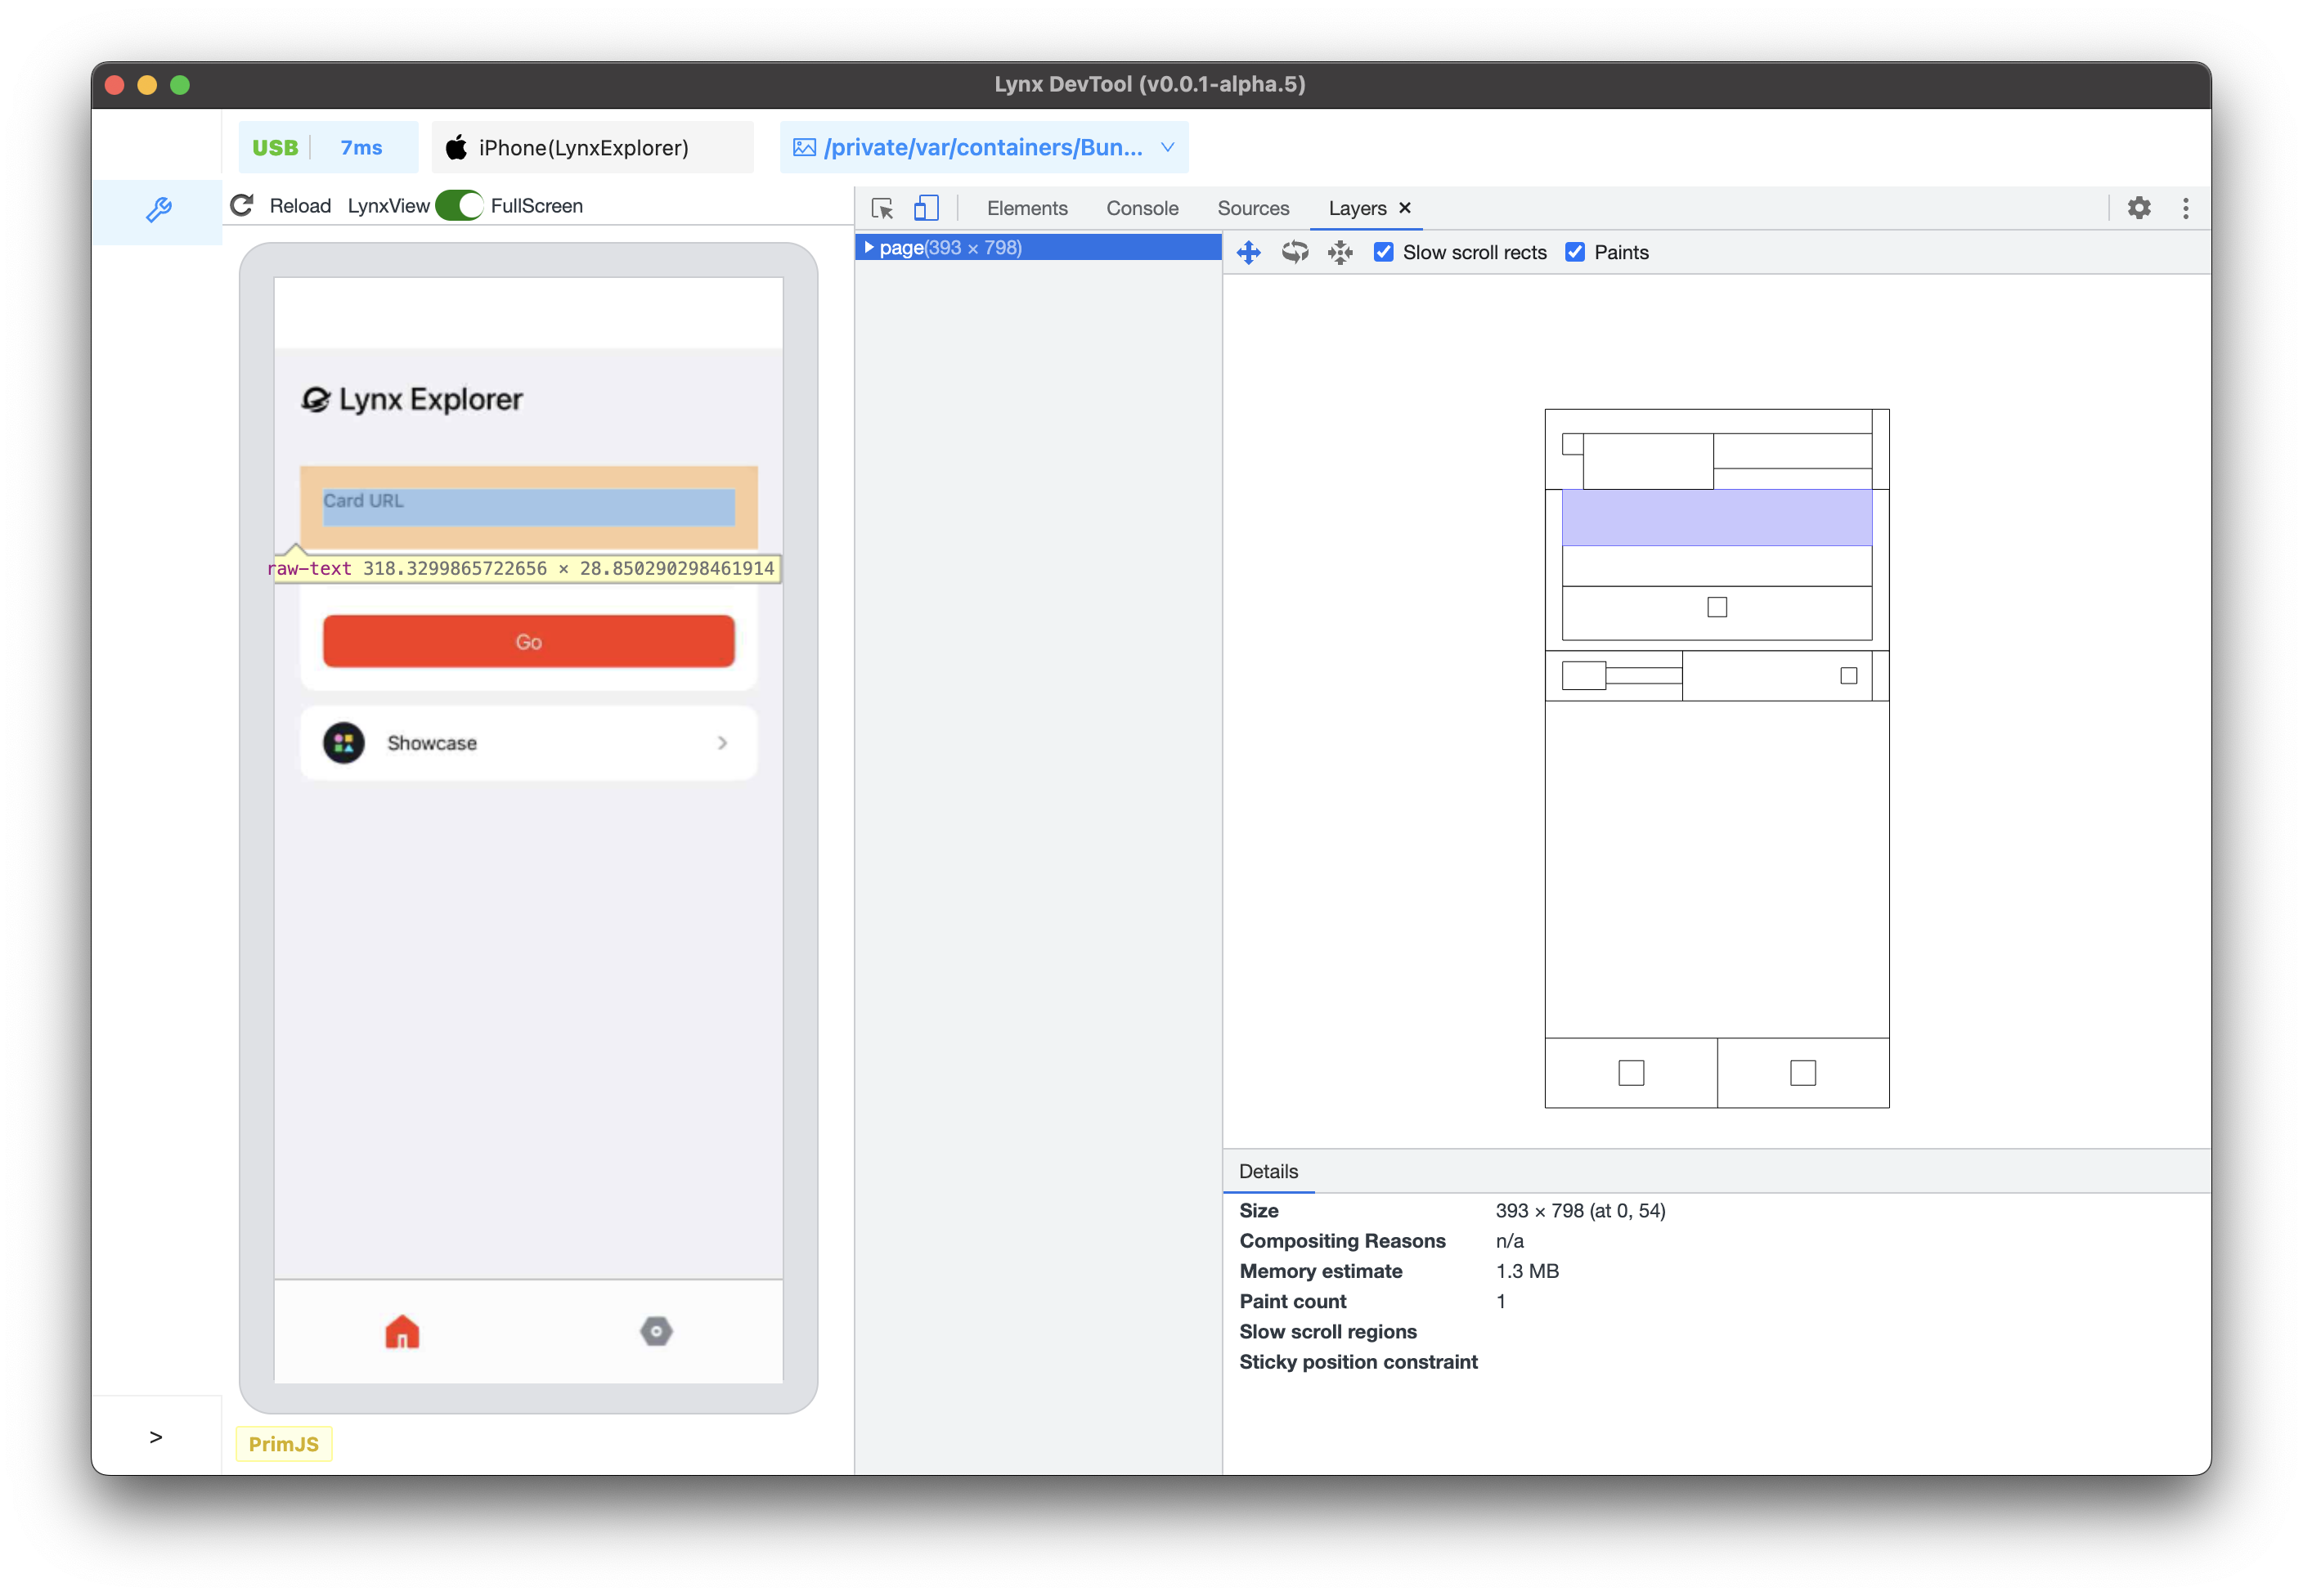
Helps you understand the composition of Lynx pages and how the framework presents content, analyzing its 3D layers to discover rendering issues.
Common Issues and Troubleshooting
Question: Why can't Lynx DevTool desktop application recognize my debugging device?
Answer: Make sure you have connected your development device (e.g., your MacBook) and the device running the Lynx application (e.g., your phone) using a data cable.
For iOS devices, ensure that you have installed Xcode and iOS SDK with matching versions on your development device.
For Android devices, in addition to ensuring a data cable connection, you also need to enable Developer Mode and USB debugging on your Android device:
- Enable Developer Mode on your Android device - specific steps may vary between devices, please refer to the Android Developer Documentation
- Enable "USB Debugging" in the developer options
- When the device is connected to your computer, an authorization prompt will appear, click "Allow"
You can try launching Xcode or Android Studio to compile and run an application to verify that you can connect to the device properly.
Provide Feedback
Welcome to experience Lynx DevTool. If you need a hand, please file an issue in Lynx Issues. Thank you!