Sources Panel
Use the Sources panel to debug JavaScript. Before you start debugging, please take some time to familiarize yourself with the Lynx JavaScript Runtime.
After DevTool is enabled, the background thread uses the PrimJS engine for debugging by default. On Android, you can also switch to the V8 engine for a more comprehensive debugging experience.
To switch to the V8 engine, open the DevTool Switch Page, toggle the "V8 Engine" switch to "On" and restart the application. You can check the current engine type in the lower-left corner of the Preview Window.
Overview
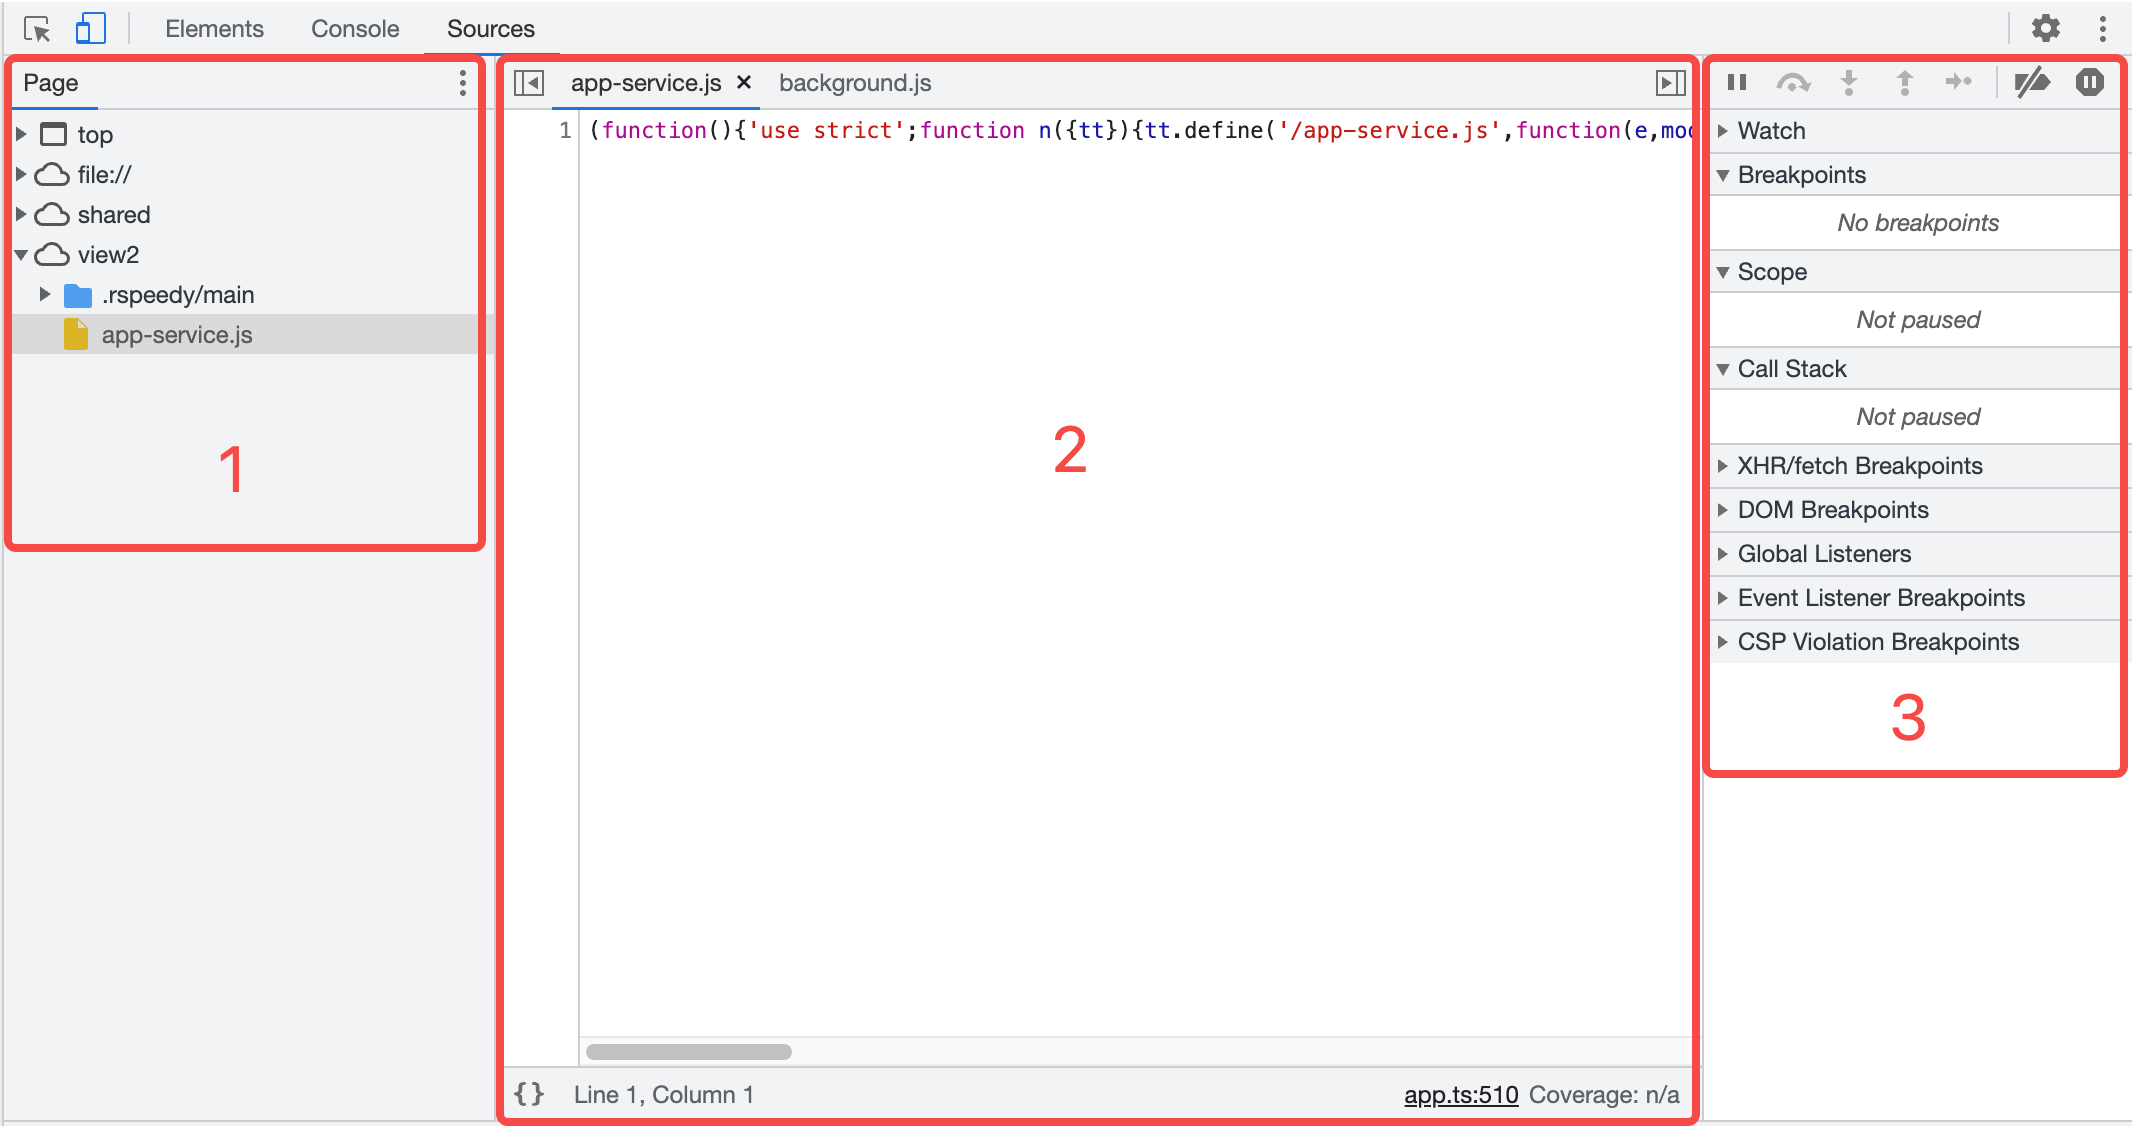
The Sources panel has three sections:
- File Navigation Pane. All JavaScript files of the page are listed here.
- Code Editor Pane. After selecting a file in the File Navigation Pane, the contents of the file are displayed here.
- Debugger Pane. Various tools for inspecting the page's JavaScript.
File Navigation
Open File
You can use the File Navigation Pane or the Open file feature to open the file of interest.
 and select Open file. A dialog will display.
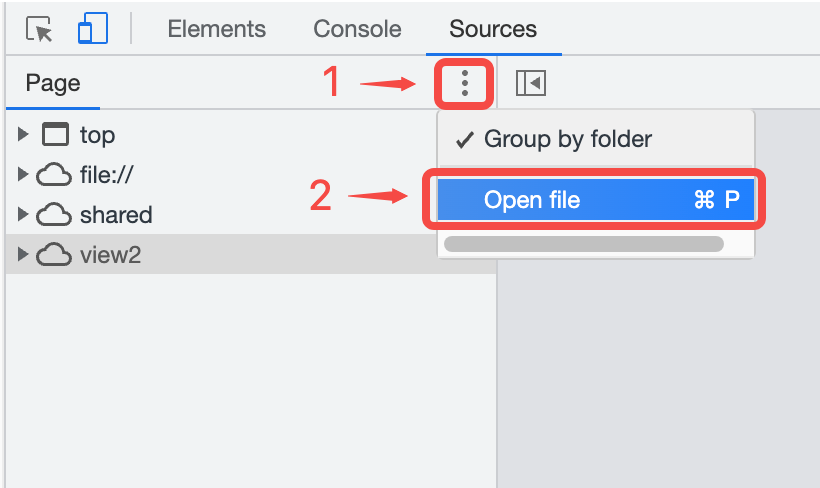
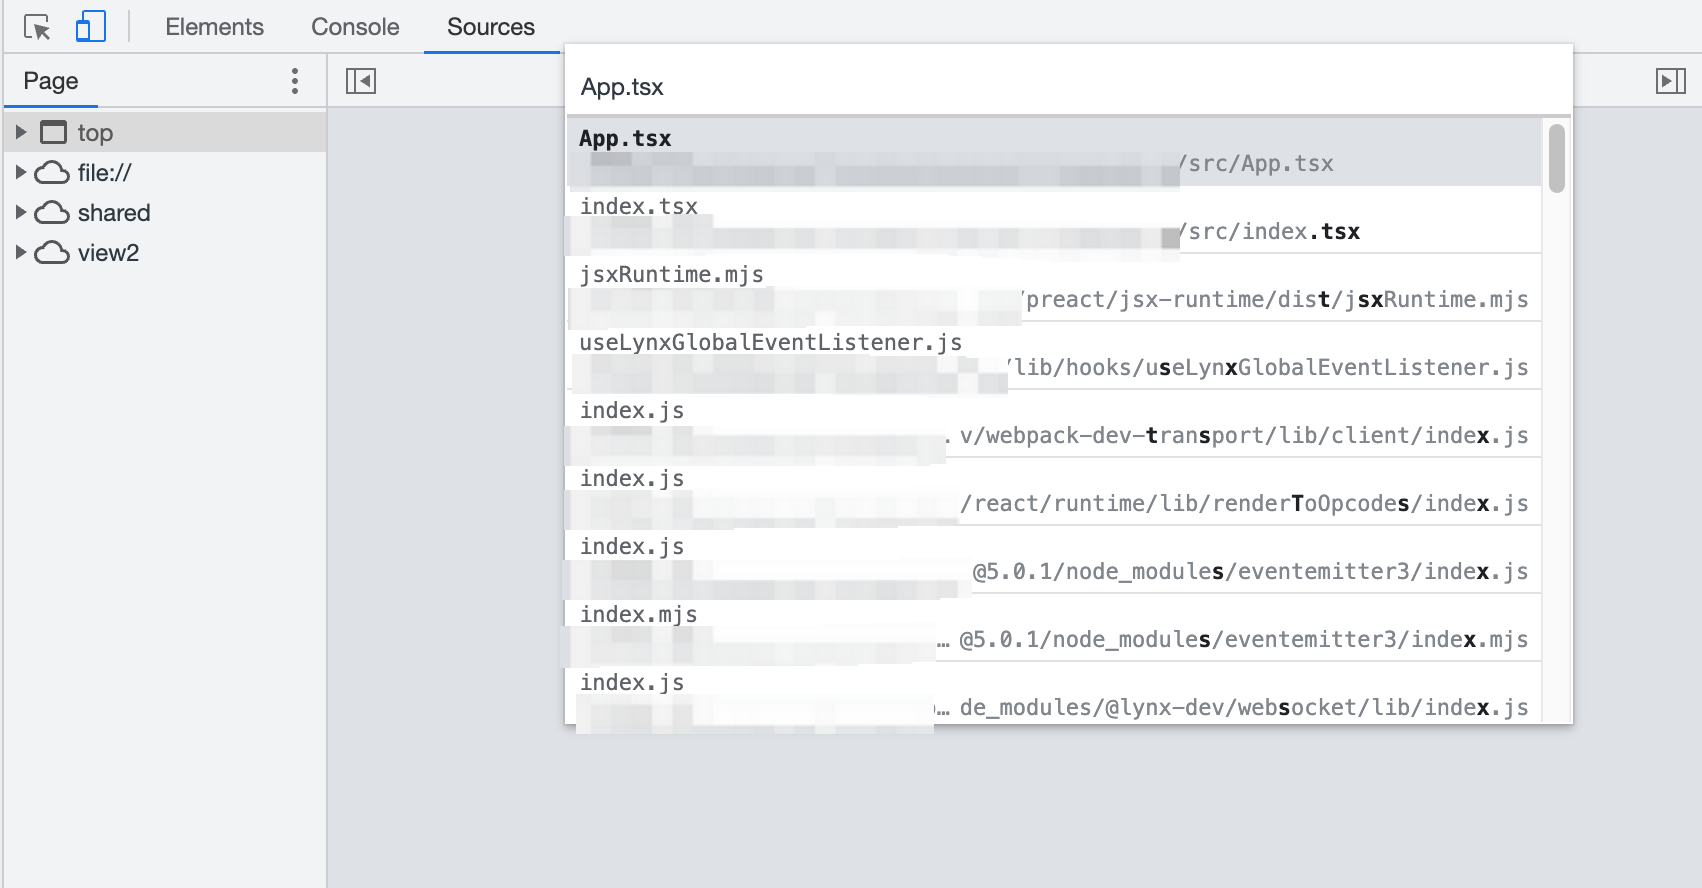
You can enter the file URL here or select a file from the drop-down list.
The bottom status bar of the Code Editor Pane will display the line and column number of the current mouse position.
 button to collapse/expand the File Navigation Pane.
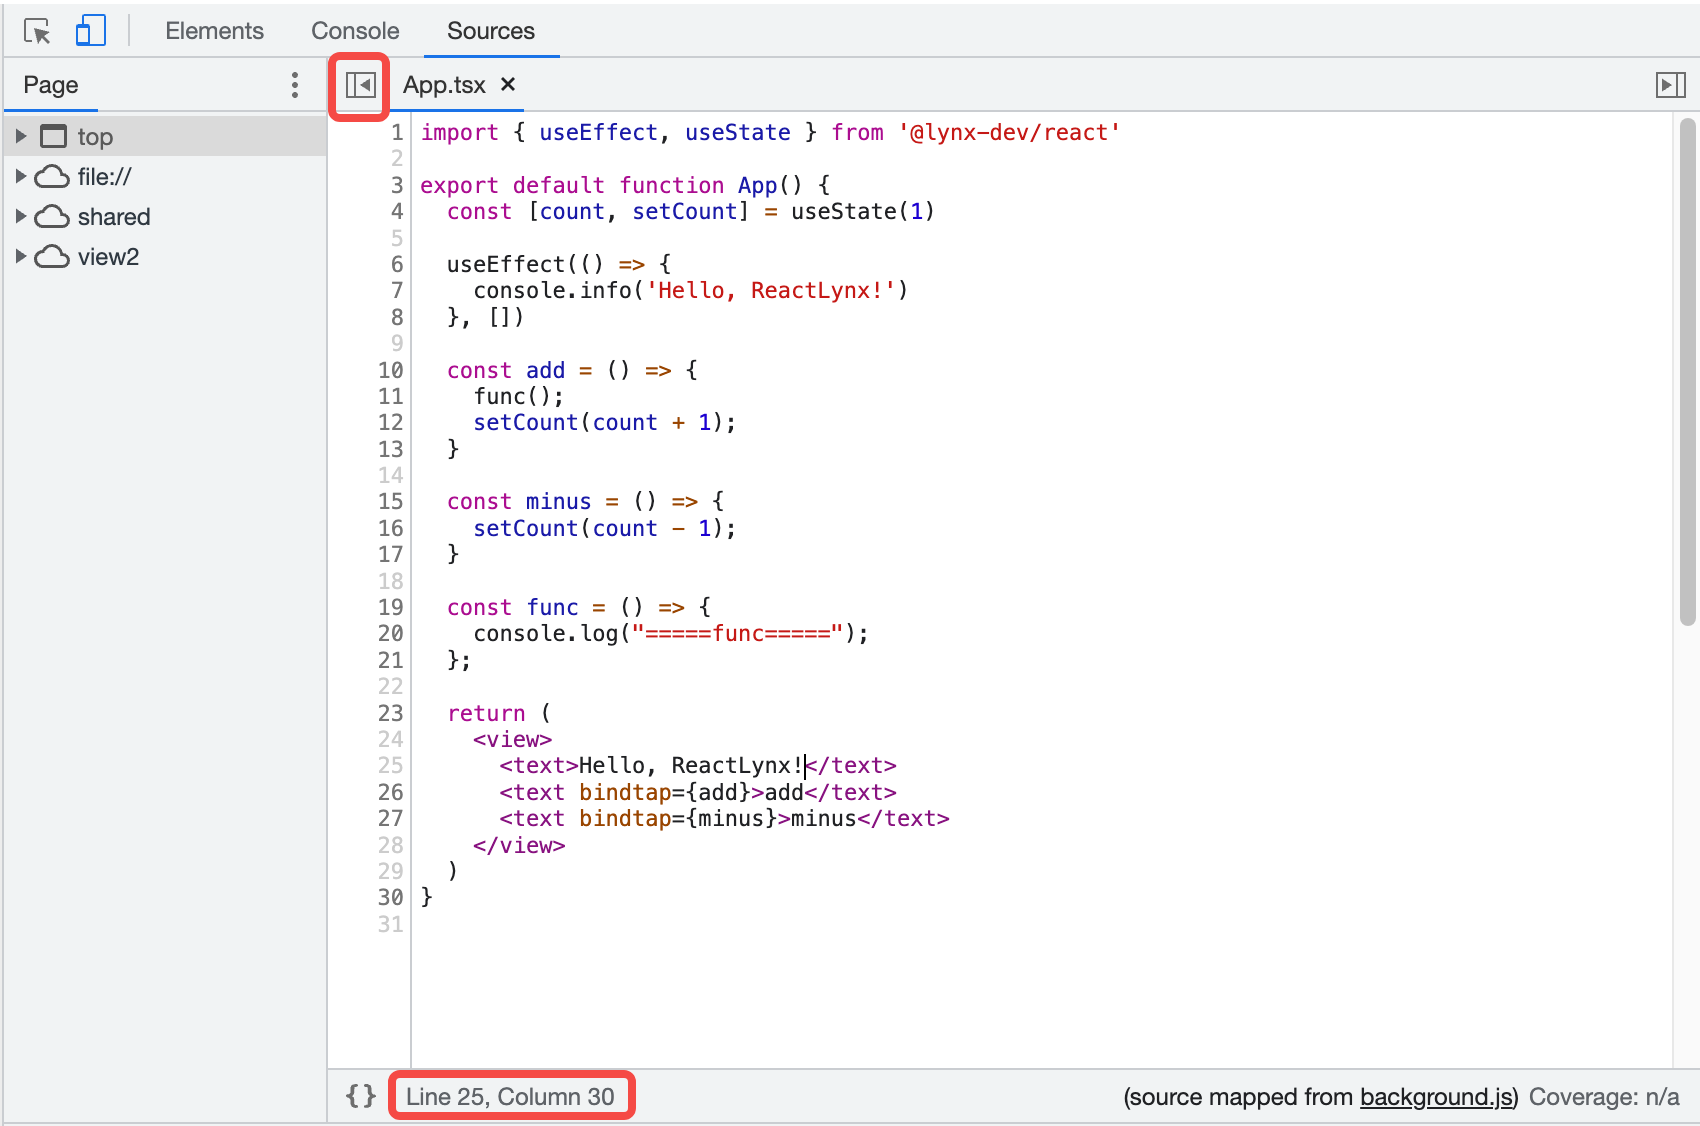
Close File
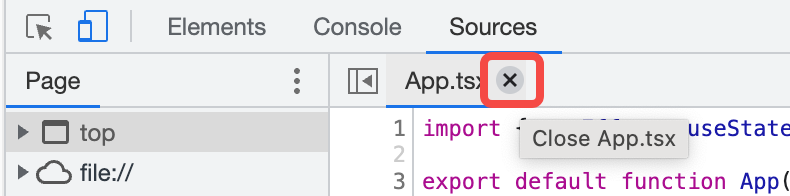
You can close a file in the following ways:
- Hover the mouse over the file name tab at the top of the Code Editor Pane and click the close button.
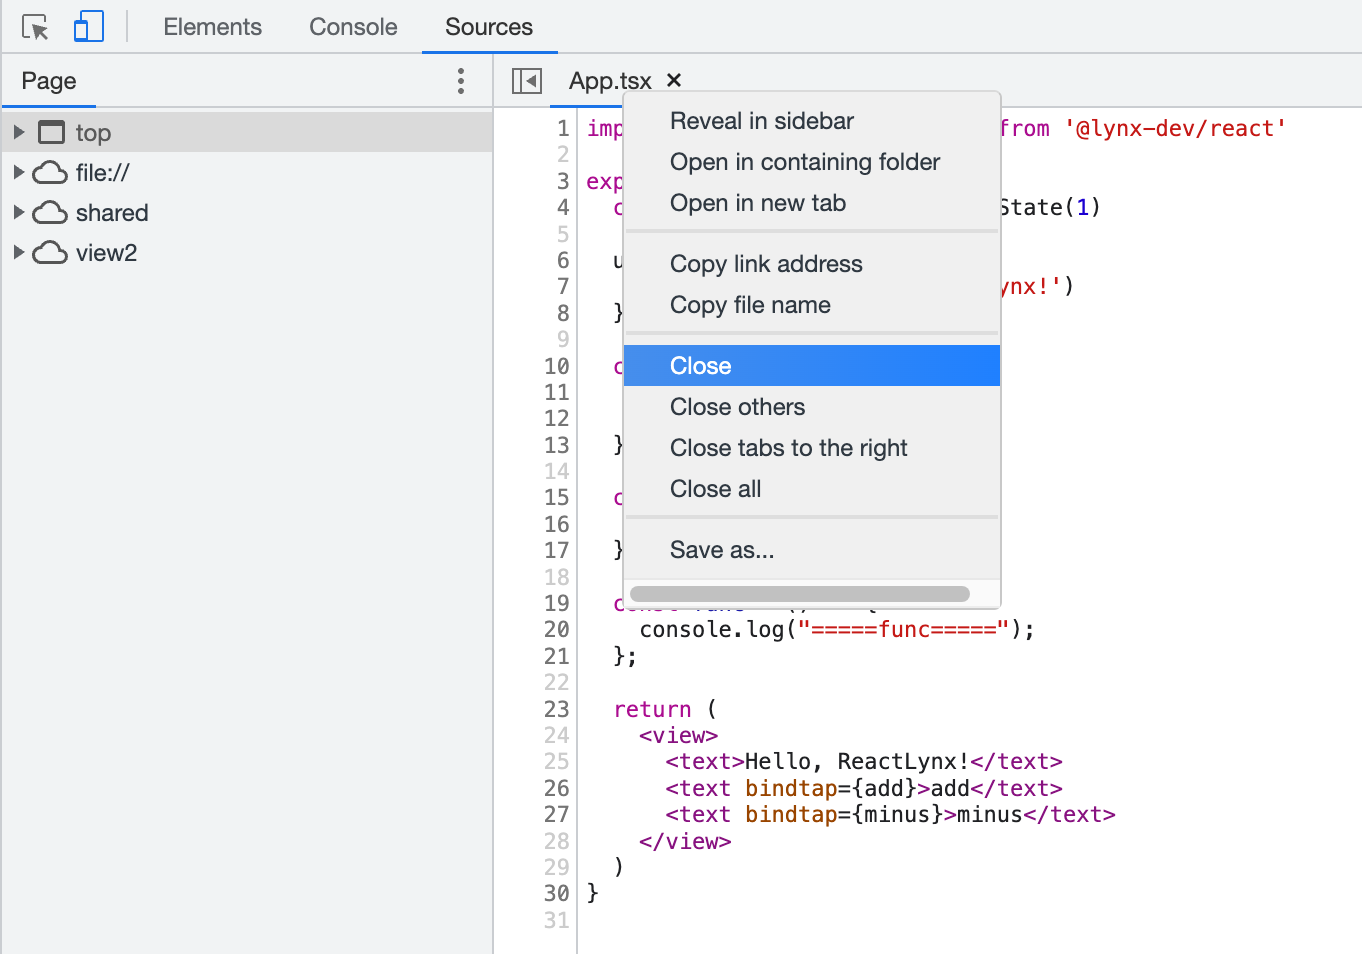
- Right-click the file name tab at the top of the Code Editor Pane:
- Close: Close the current file.
- Close others: Close other files.
- Close all: Close all files.
Locate File
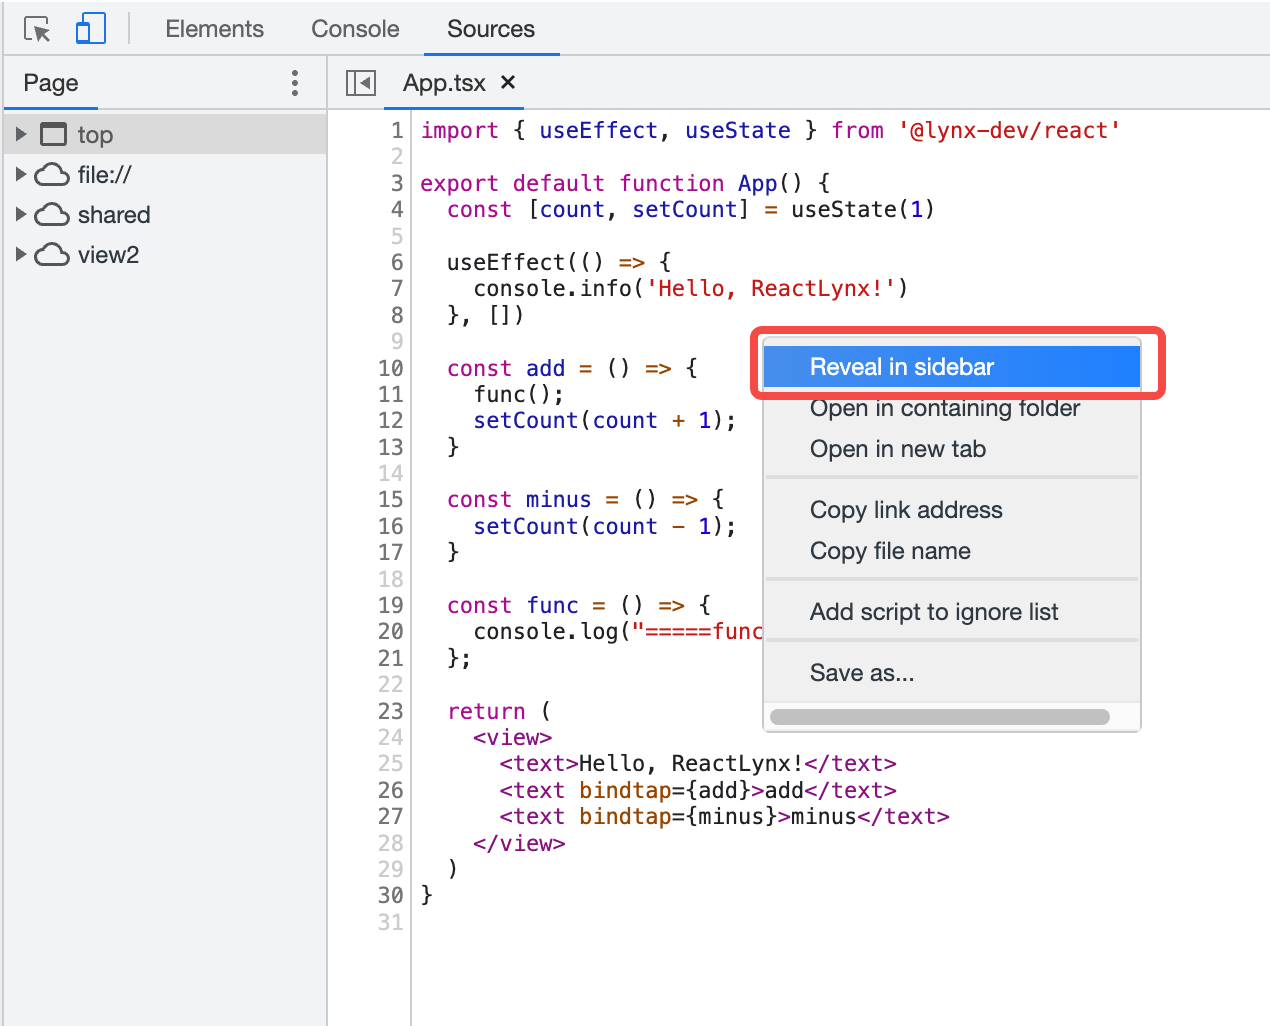
To locate the file currently displayed in the Code Editor Pane:
- Right-click anywhere in the Code Editor Pane or right-click the file name tab at the top of the Code Editor Pane.
- Select Reveal in sidebar.
Search Code
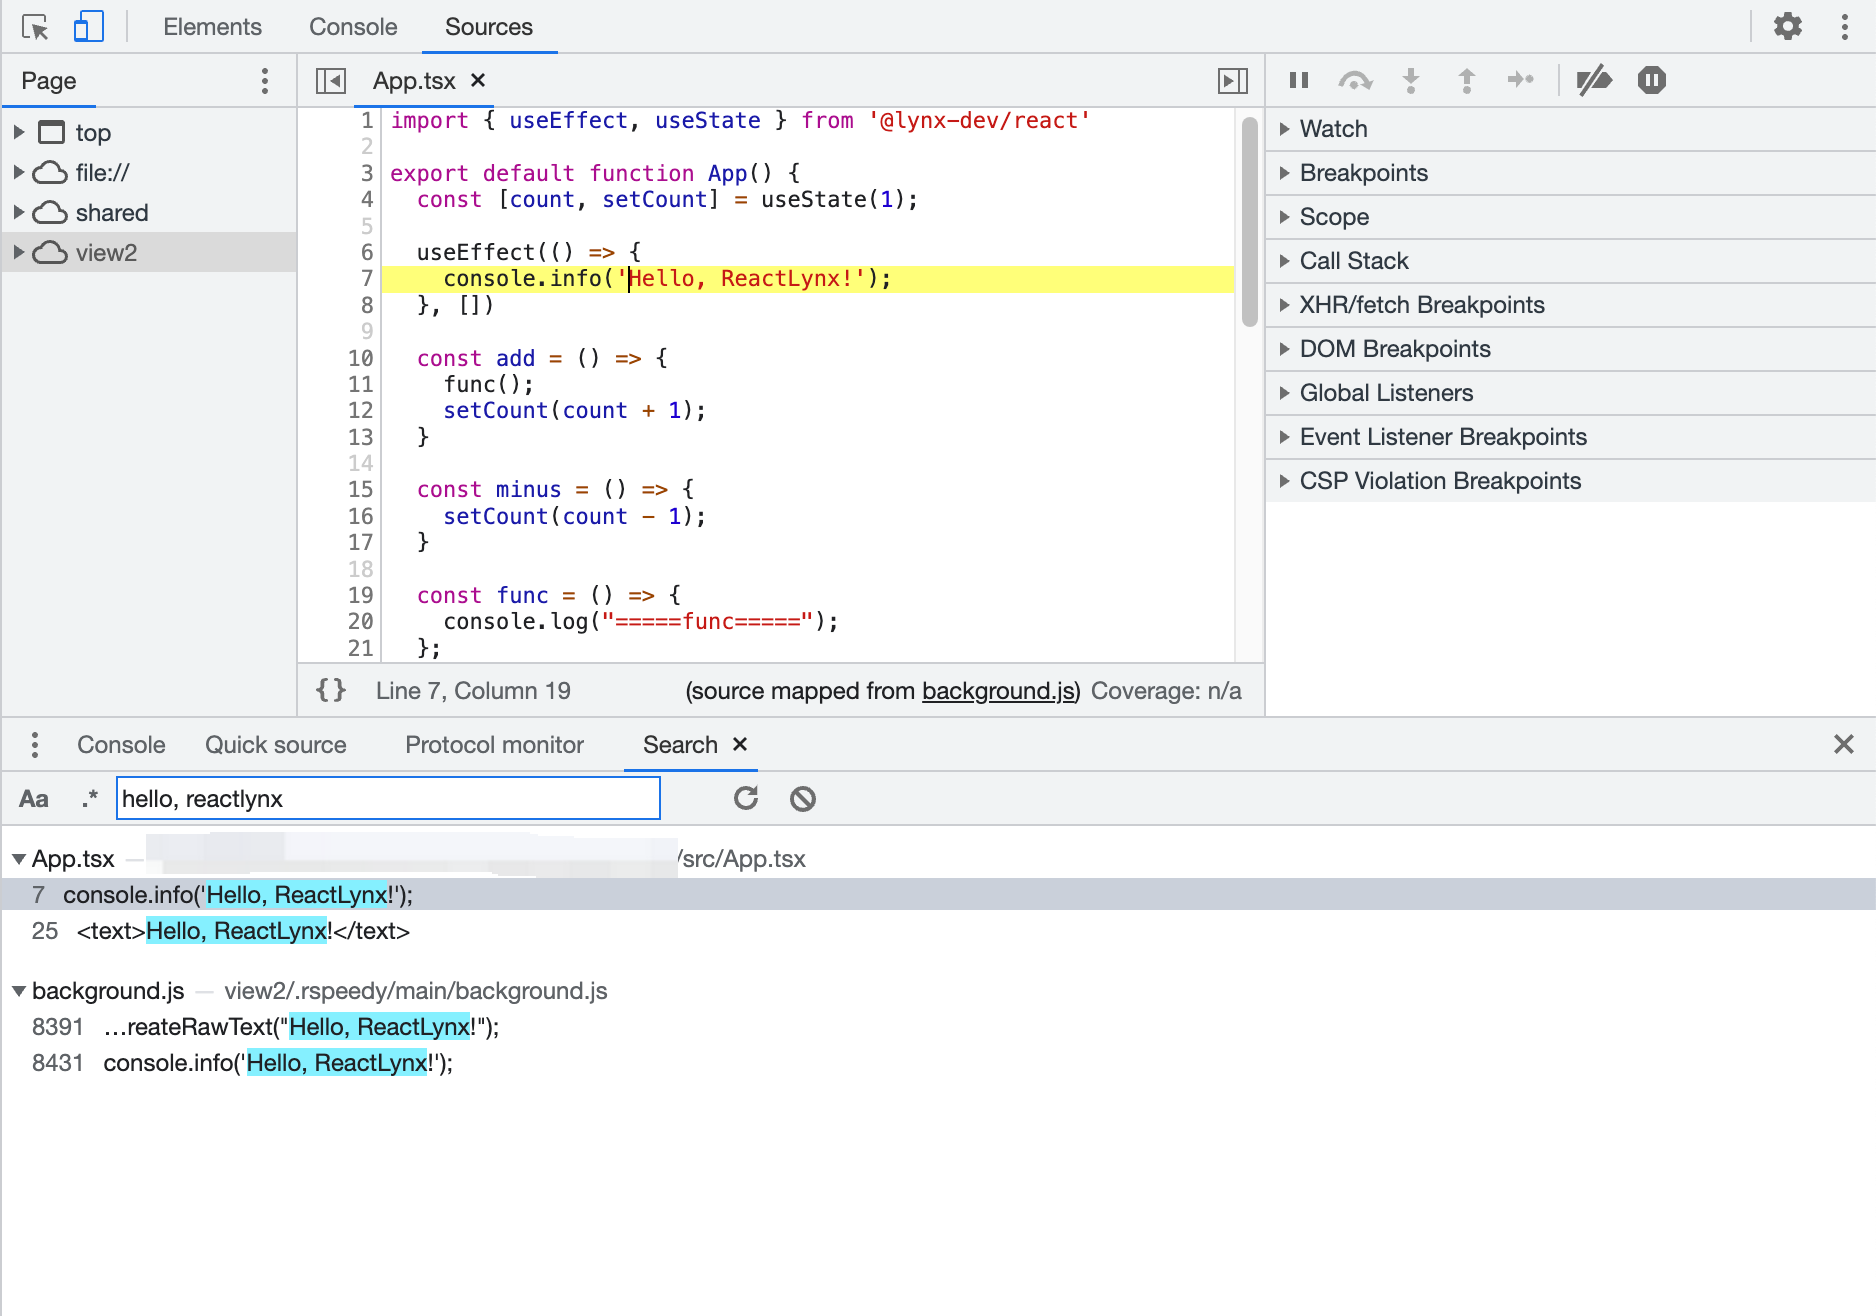
To search a code segment:
-
Click Customize And Control DevTools > Search to open the Search panel.
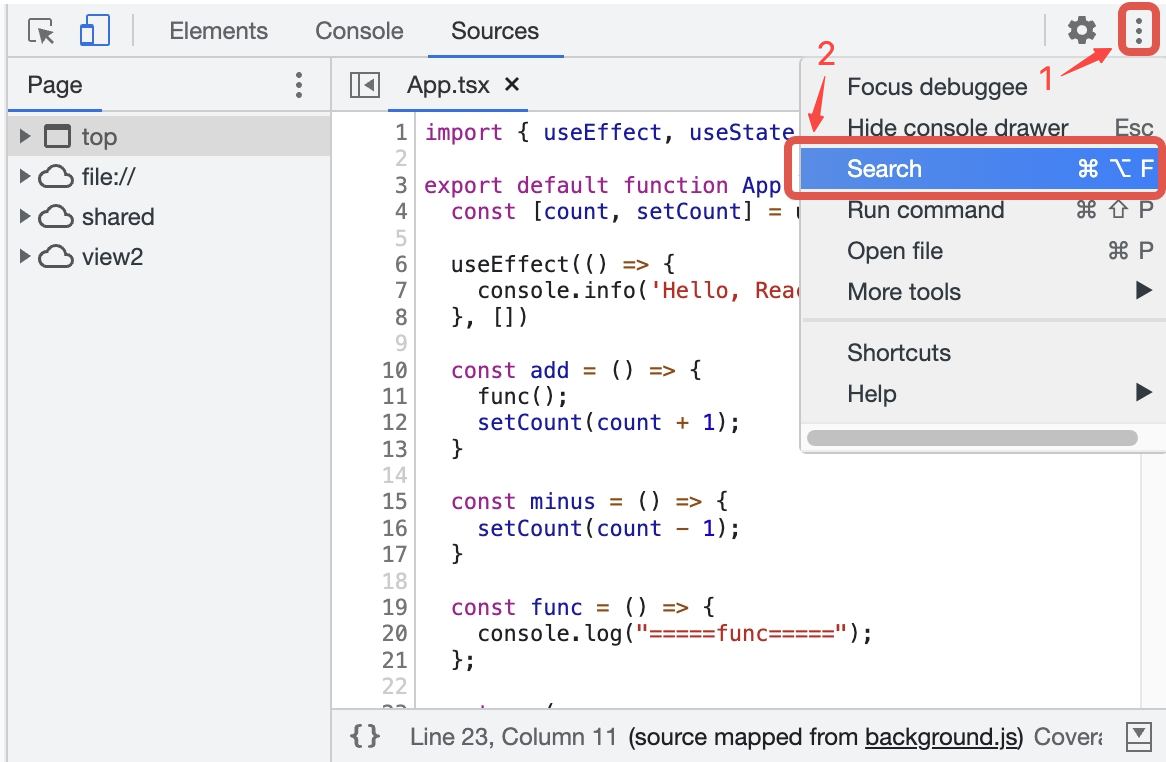
- Enter text and press Enter to search.
- Click search results to jump to the corresponding file and the code will be highlighted.
You can also:
-
Click Match Case
 to make the query case-sensitive.
 -
Click Use Regular Expression
 to search using a RegEx.
 -
Click Refresh
 to search again.
 -
Click Clear
 to clear the input contents.
Pause Code with Breakpoints
By adding breakpoints, you can pause the code execution and inspect all relevant values at that moment.
Currently supported breakpoint types are as follows:
| Type | Description |
|---|---|
| Line-of-code | Pause on an exact region of code. |
| Conditional line-of-code | Pause on an exact region of code, but only when some other condition is true. |
| Logpoint | Log a message to the Console without pausing the execution. |
| First line | Pause on the first line of every executed JavaScript file. |
| Exception | Pause on the line of code that is throwing a caught or uncaught exception. |
Line-of-Code Breakpoints
Please refer to Line-of-code breakpoints | Chrome DevTools.
Line-of-Code Breakpoints in Code
Please refer to Line-of-code breakpoints in your code | Chrome DevTools.
Conditional Line-of-Code Breakpoints
Please refer to Conditional line-of-code breakpoints | Chrome DevTools.
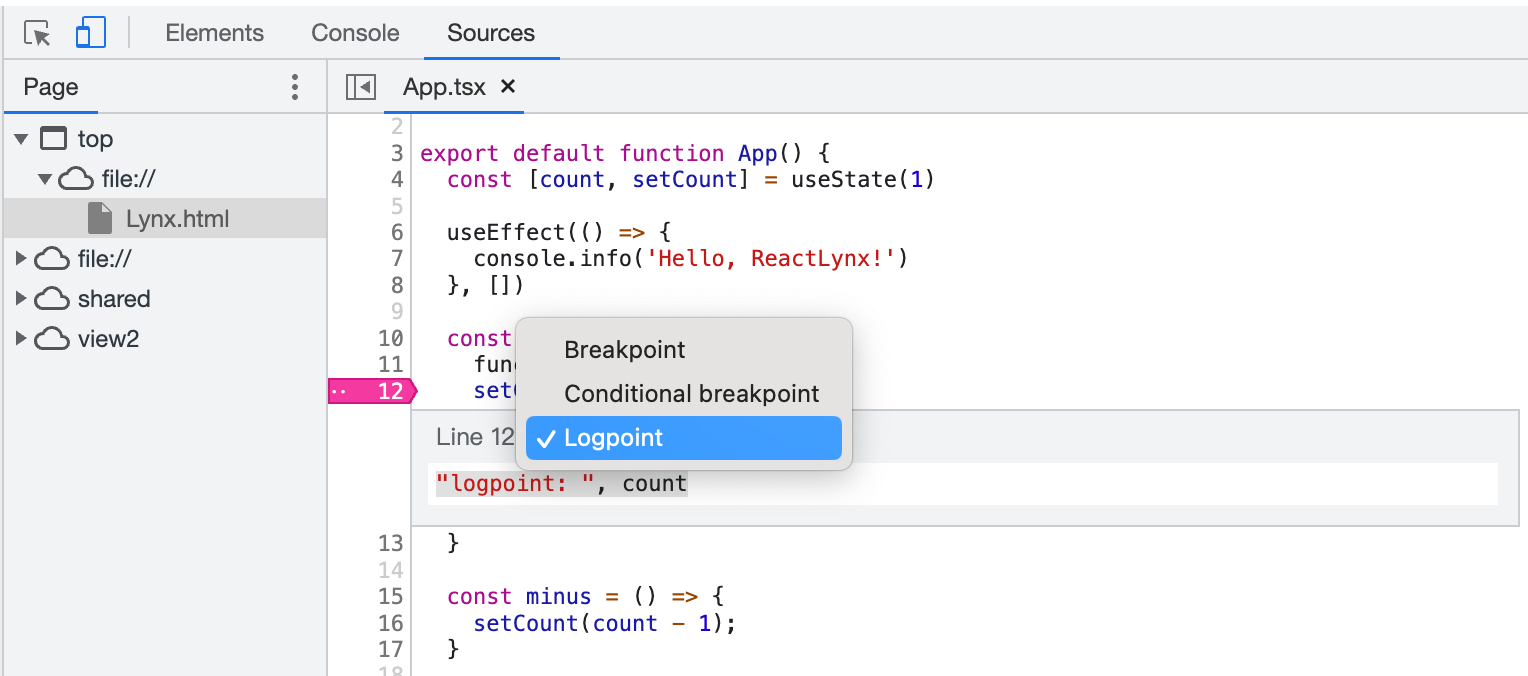
Log Line-of-Code breakpoints
Please refer to Log line-of-code breakpoints | Chrome DevTools.
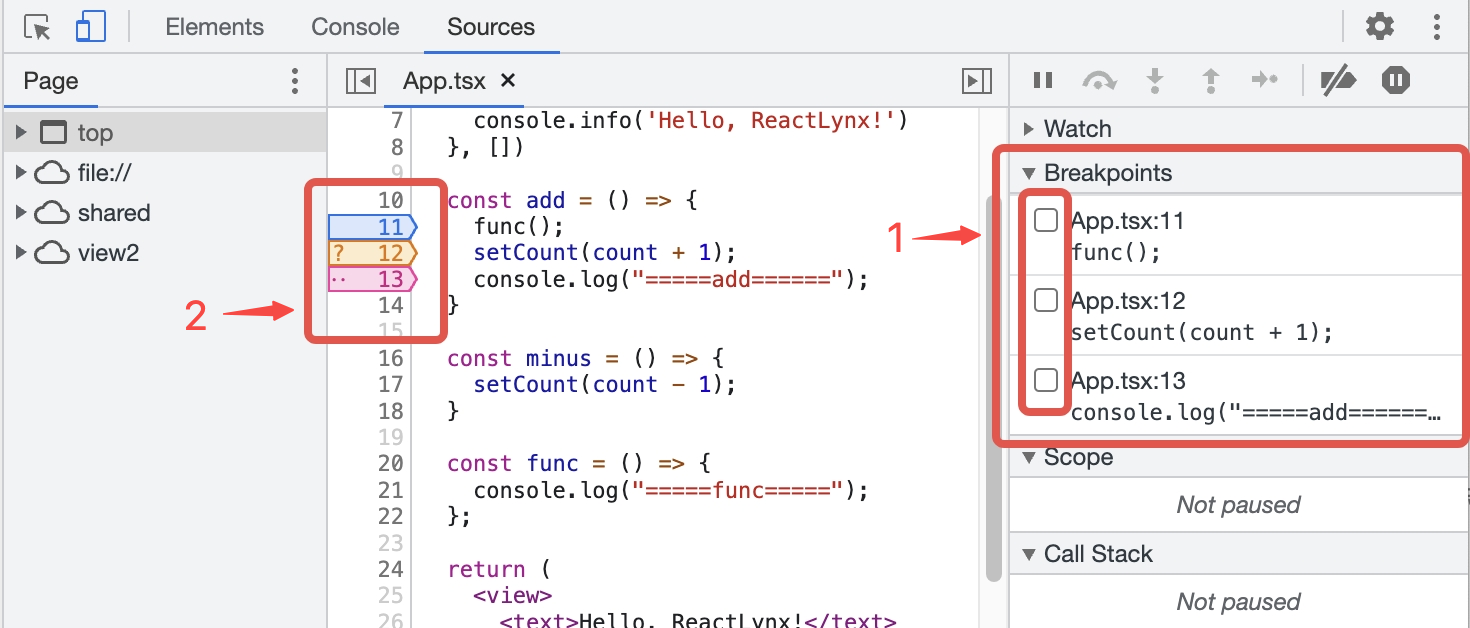
Manage Line-of-Code Breakpoints
Right-click the breakpoint icon or use the Breakpoints pane to manage line-of-code breakpoints.
-
Right-click the breakpoint icon and select Edit breakpoint to edit it. You can also change its type from the drop-down list in the inline editor.
-
Click the breakpoint icon again to delete the breakpoint.
-
In the Breakpoints pane, click the checkbox next to the breakpoint entry to enable or disable the breakpoint. When disabled, the marker next to the line number will become transparent.
-
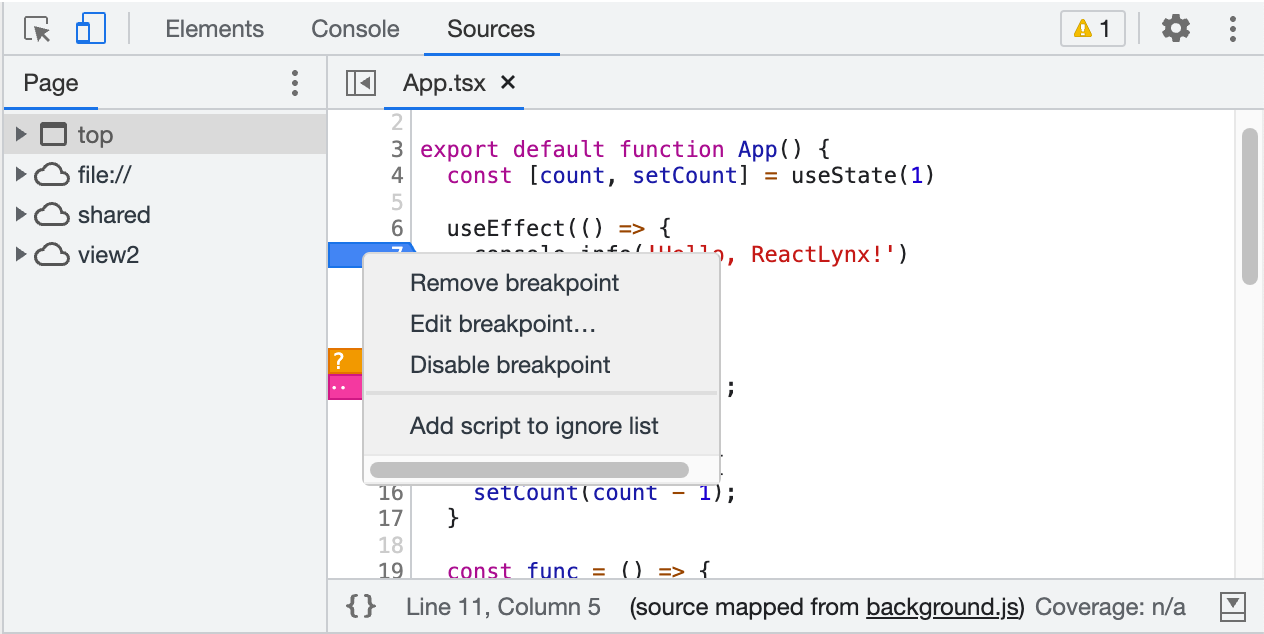
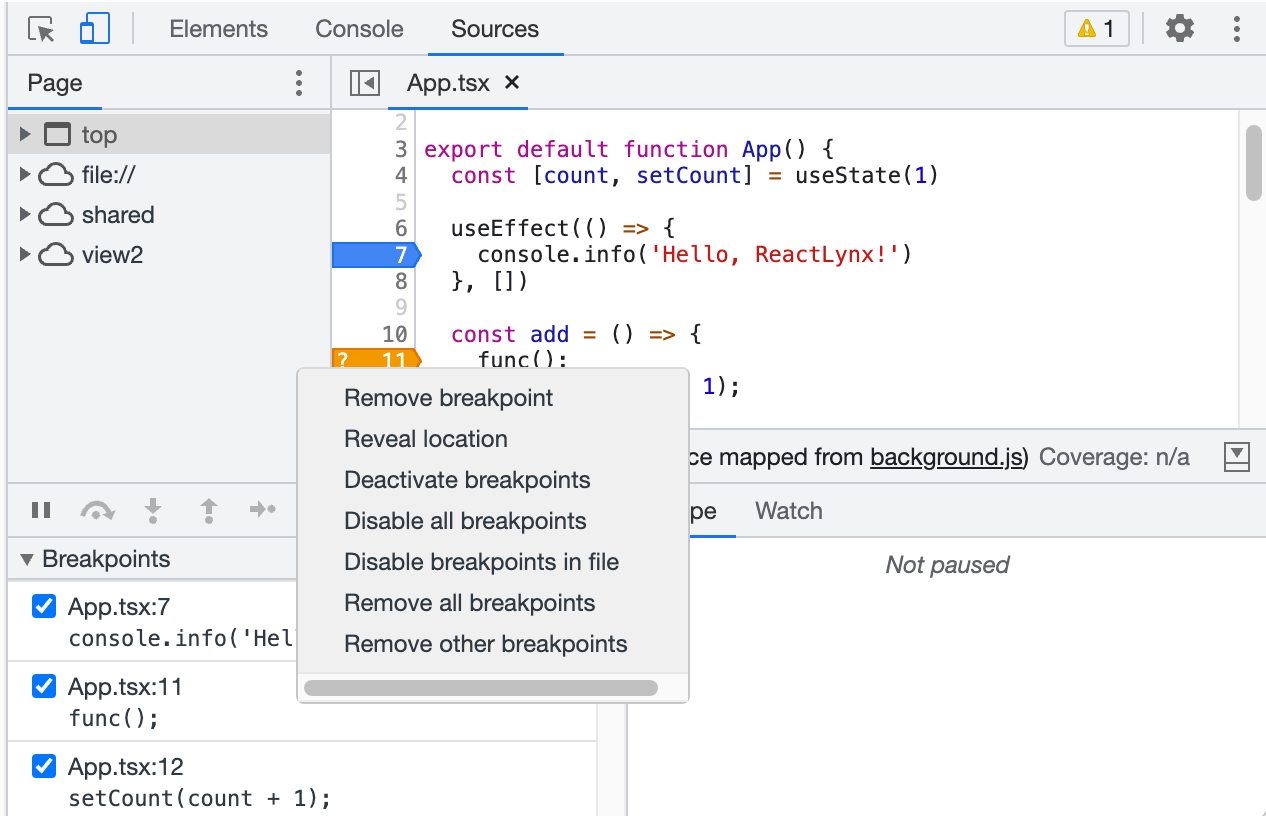
Right-click the breakpoint icon to see the options menu:
- Remove breakpoint.
- Edit breakpoint.
- Disable/Enable breakpoint.
-
Right-click the breakpoint entry in the Breakpoints pane to see the options menu:
- Remove breakpoint.
- Reveal location.
- Deactivate/Activate breakpoints.
You can also use Deactivate breakpointsWhen breakpoints are deactivated, DevTool will ignore all line-of-code breakpoints, and they will not be triggered. All breakpoints will remain in the same state after being reactivated.
 button to deactivate breakpoints.
 - Disable/Enable all breakpoints.
- Disable/Enable breakpoints in file.
- Remove all breakpoints.
- Remove other breakpoints.
Skip Breakpoints with 'Never Pause Here' Background V8 Only
Please refer to Skip breakpoints with 'Never pause here' | Chrome DevTools.
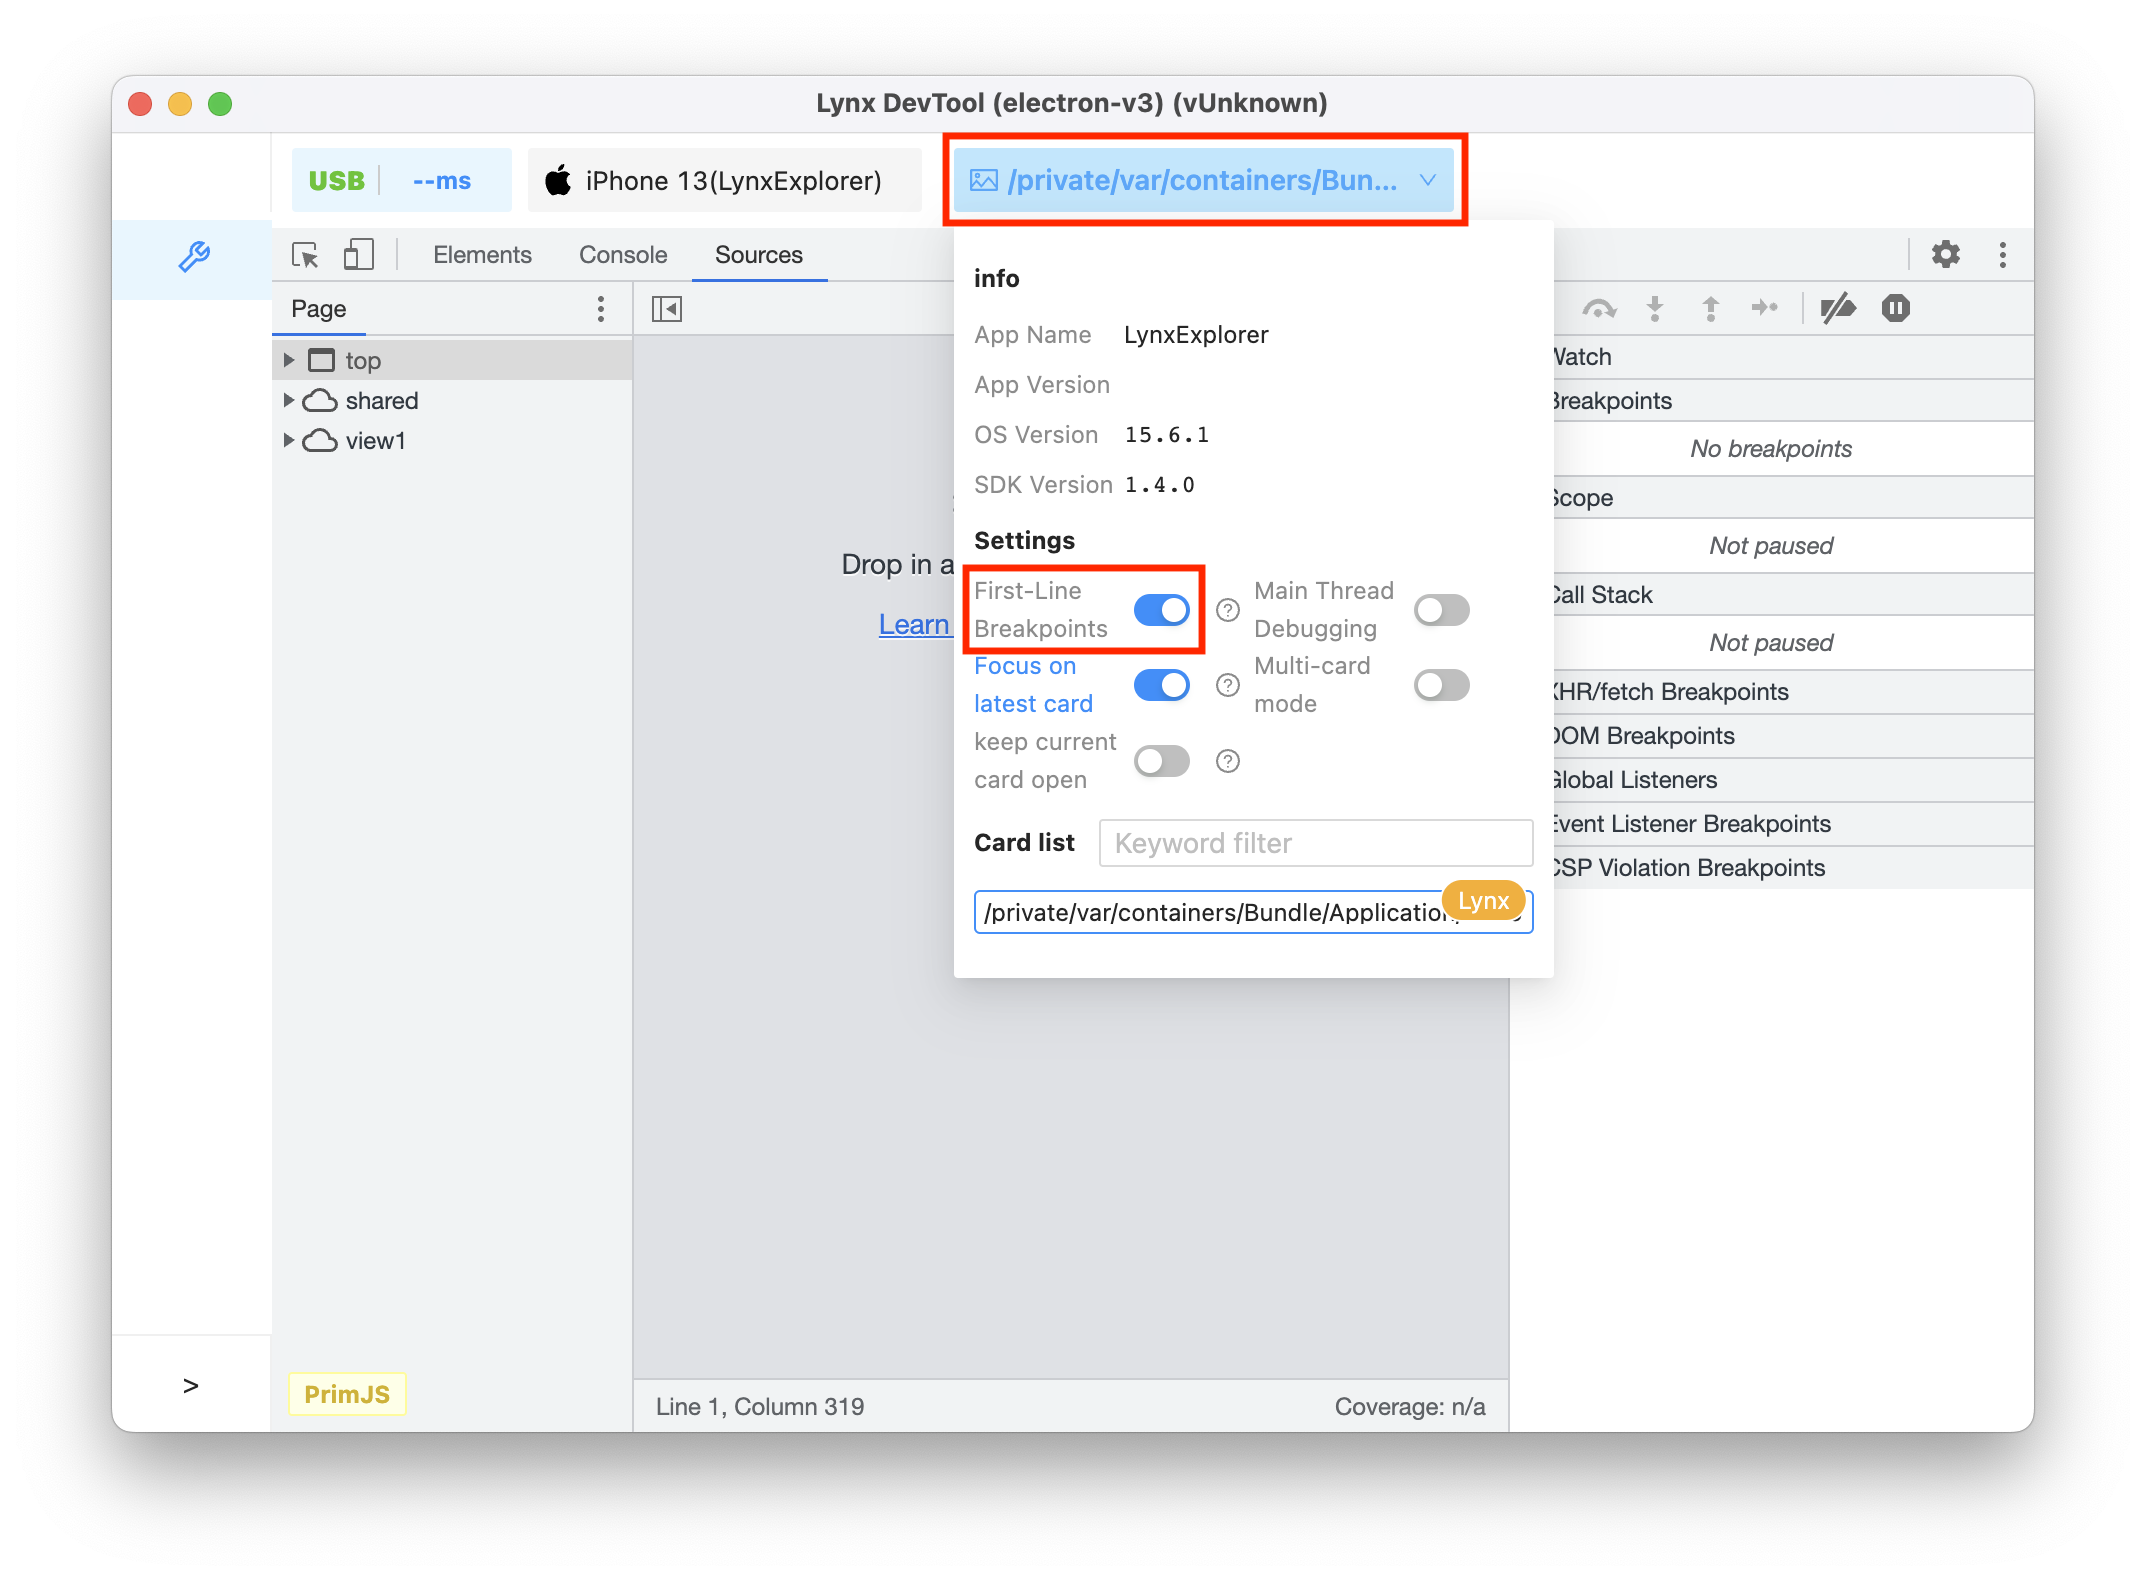
First-Line Breakpoints Background Only
Use first-line breakpoints to pause at the entry of every executed JavaScript file.
Hover your mouse over the position shown in the image, then enable First-Line Breakpoints. This is a non-persistent global switch that takes effect for all pages during a single APP run. The switch state will be reset after closing and restarting the APP.
You can debug first-line breakpoints in two ways:
- Turn on the switch, then open the page you want to debug.
- Open the page you want to debug, turn on the switch, and then reload the page.
Exception Breakpoints
Use exception breakpoints when you want to pause on the line of code that's throwing a caught or uncaught exception.
- In the Breakpoints pane, click the Pause on exceptions button, which turns blue when enabled.
- By default, it only pause on uncaught exceptions. If you also want to pause on caught exceptions, check the Pause On Caught Exceptions checkbox.
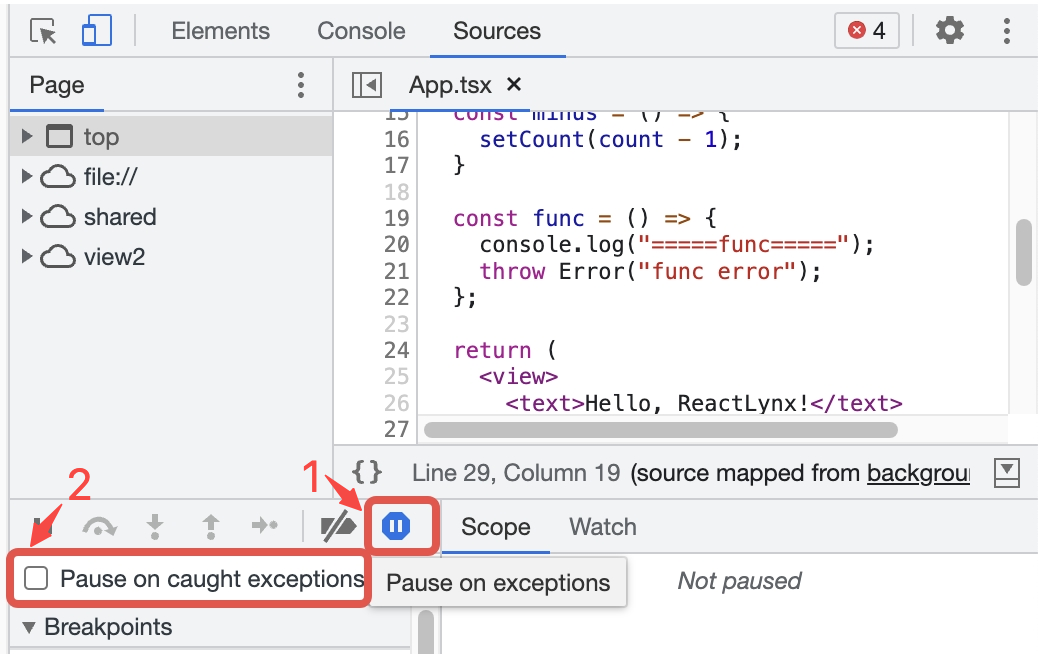
Currently, the PrimJS engine does not distinguish between caught and uncaught exceptions, and all exceptions will cause a pause. In contrast, the V8 engine distinguishes between caught and uncaught exceptions.
Debug JavaScript
By default, you can only debug the background thread. If you need to debug the main thread, please refer to the section Debug the Main Thread.
Step Through Code
Once your code is paused, step through it, one expression at a time, investigating control flow and property values along the way.
Step Over
Please refer to Step over line of code | Chrome DevTools.
Step Into
Please refer to Step into line of code | Chrome DevTools.
Step Out
Please refer to Step out of line of code | Chrome DevTools.
Run All Code Up to a Certain Line Background V8 Only
Please refer to Run all code up to a certain line | Chrome DevTools.
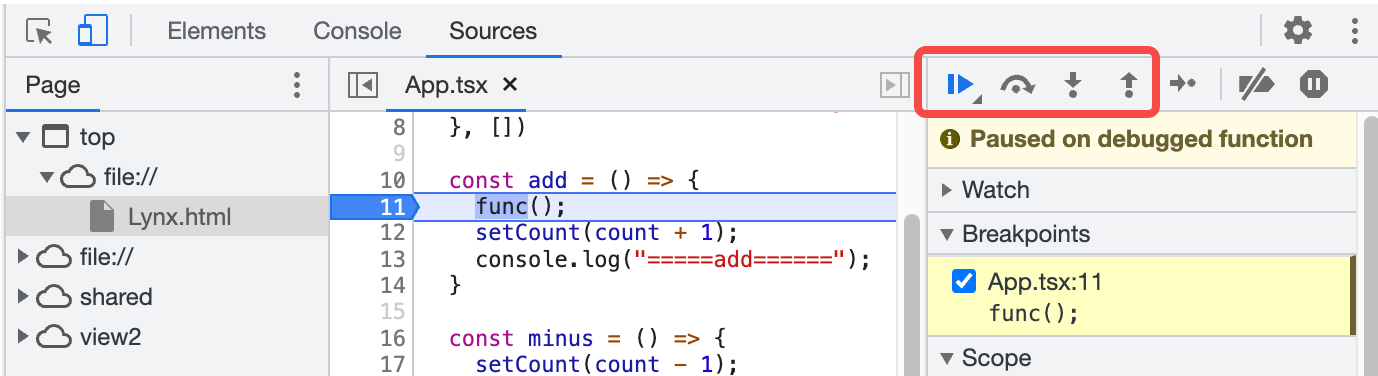
Resume
Please refer to Resume script execution | Chrome DevTools.
Terminate Execution Background V8 Only
To stop your script's execution after a pause, click and hold the Resume button and then select Terminate script execution button.
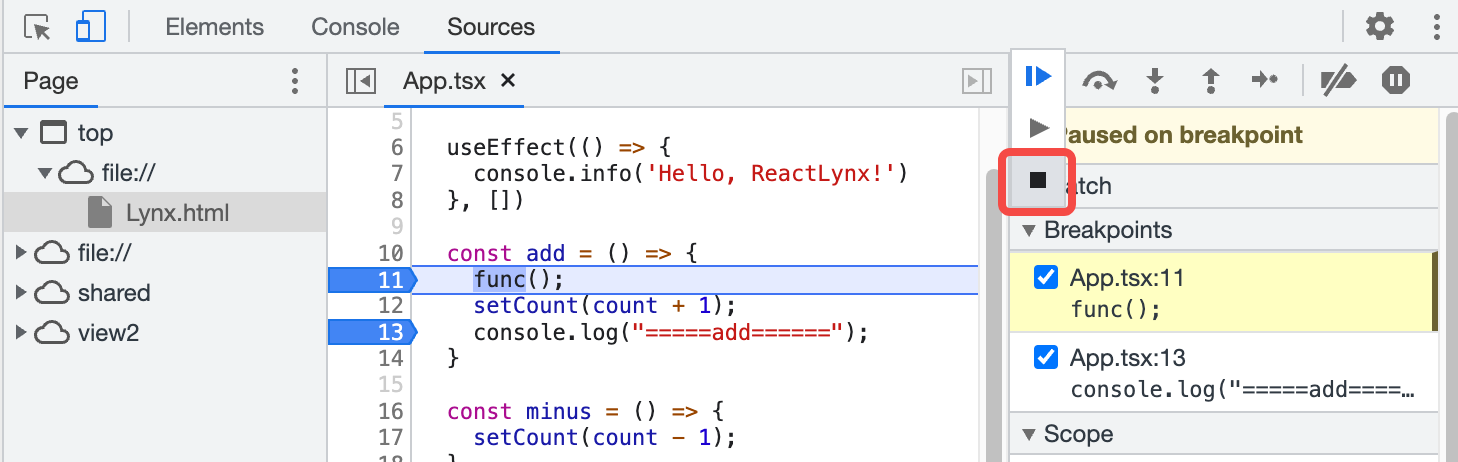
For example, in this case, select Terminate script execution, DevTool will
stop executing the script, the rest of the code in add will not be executed,
and you will see that the value of count will not change.
View and Edit Properties
Please refer to View and edit local, closure, and global properties | Chrome DevTools.
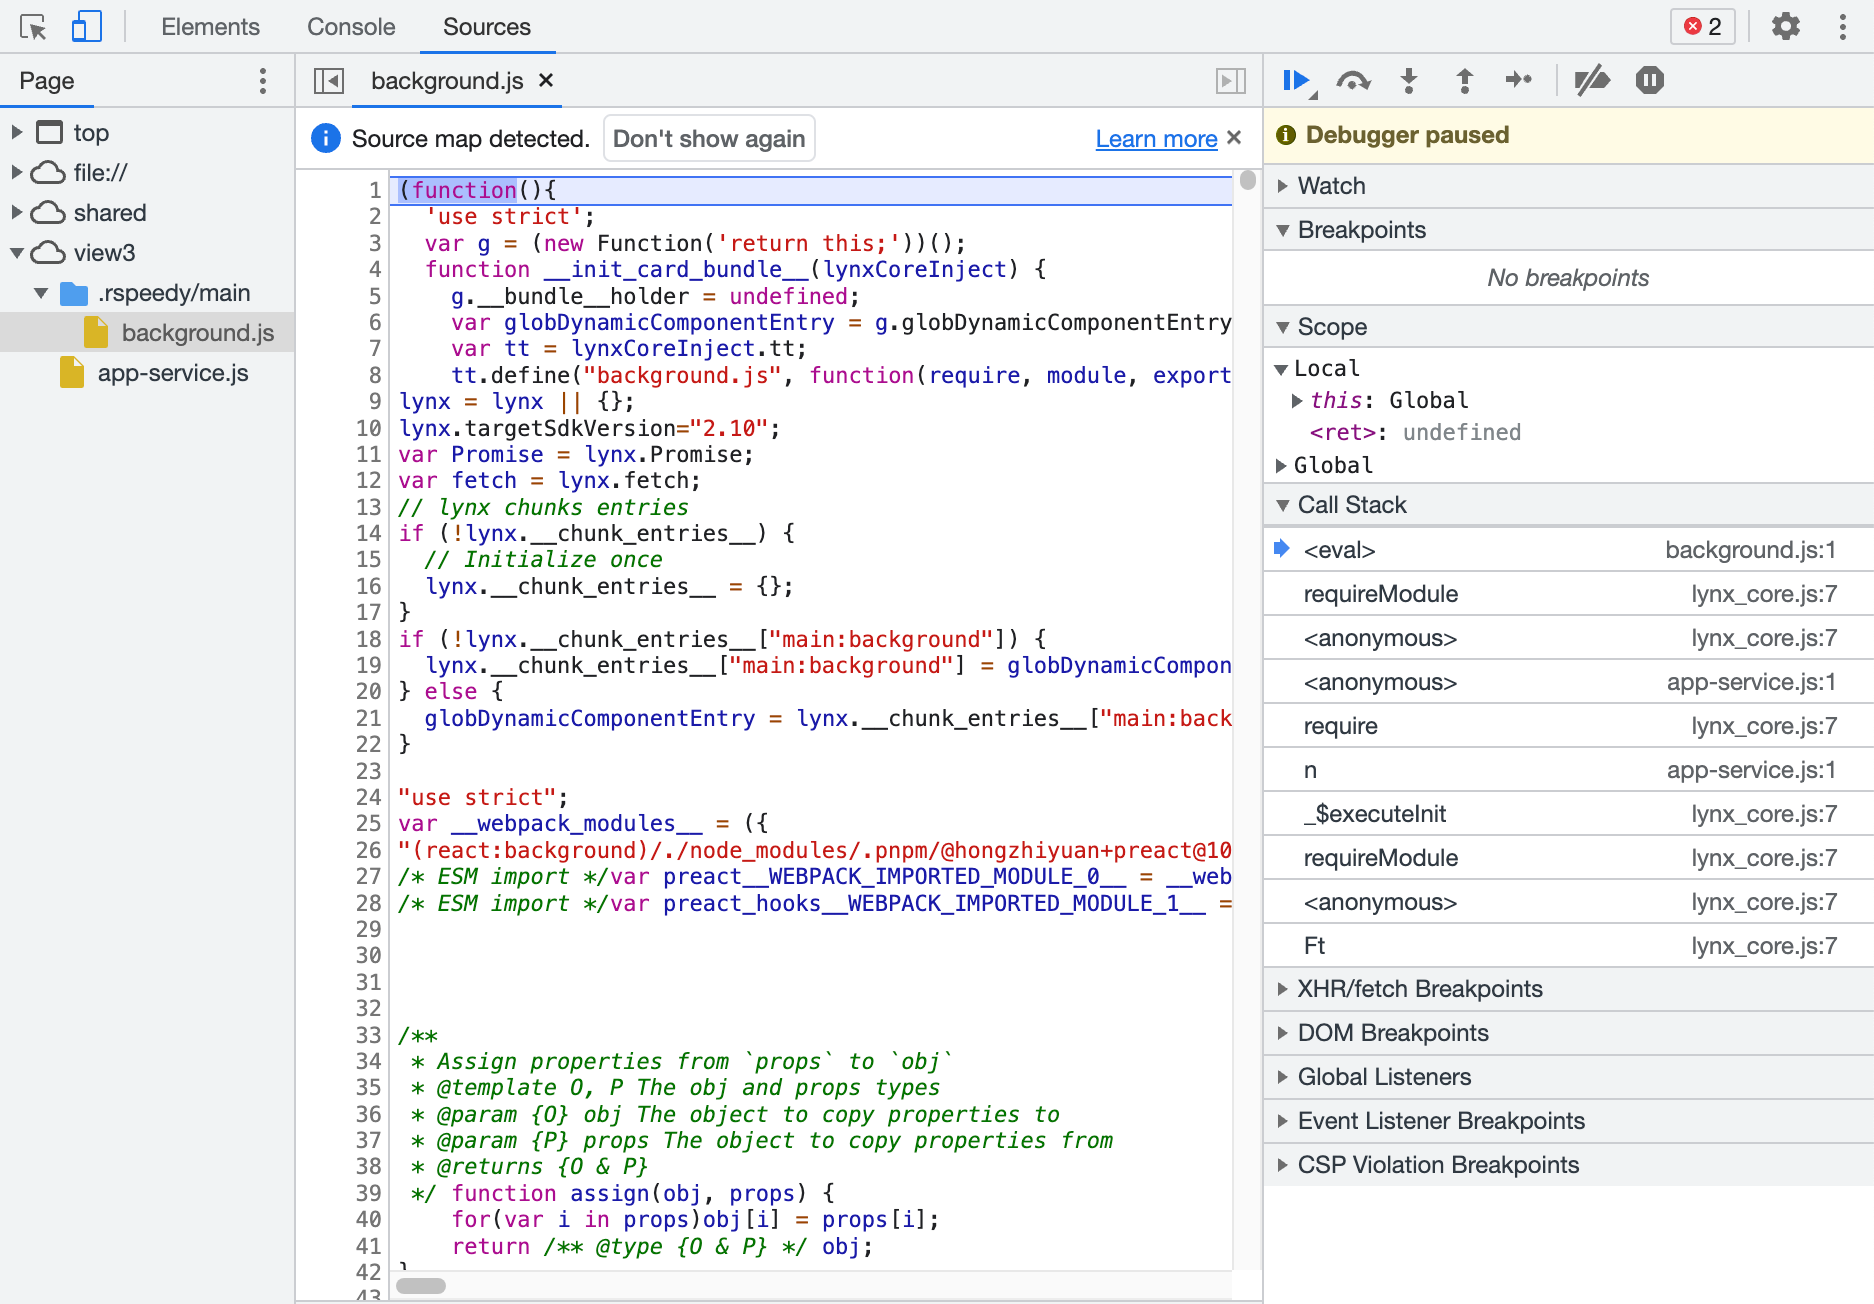
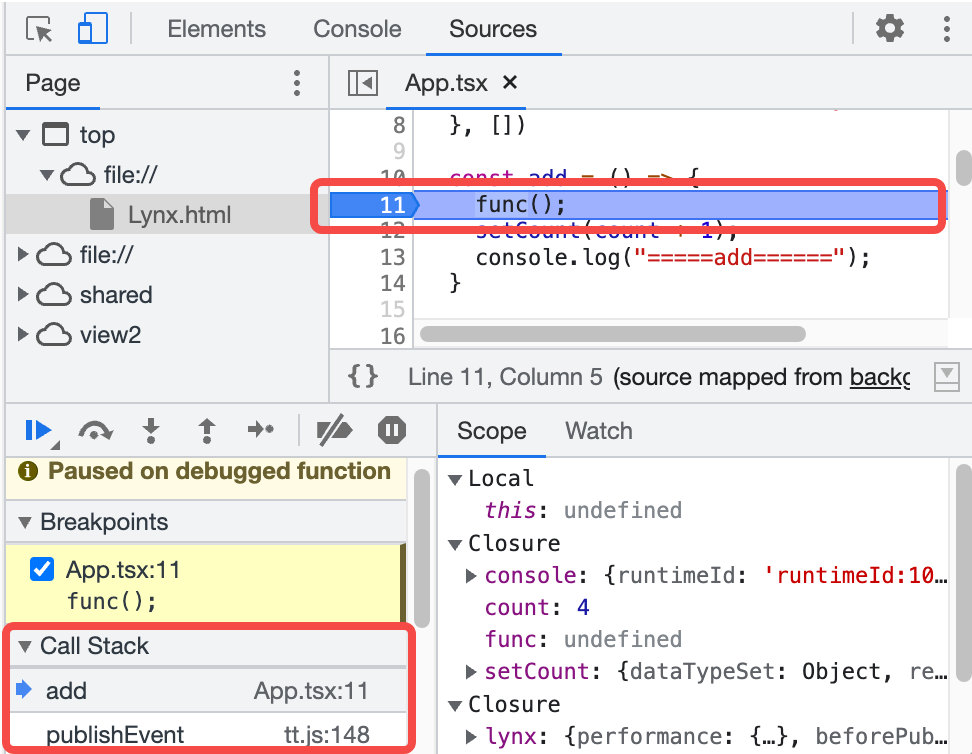
View the Current Call Stack
When paused on a line of code, you can use the Call Stack pane to view the call stack that got you to this point.
Select an entry in the pane to jump to the line of code where the function was called. A blue arrow icon represents the currently highlighted code.
Copy Stack Trace
Right-click anywhere in the Call Stack pane and select Copy stack trace to copy the current call stack to the clipboard.
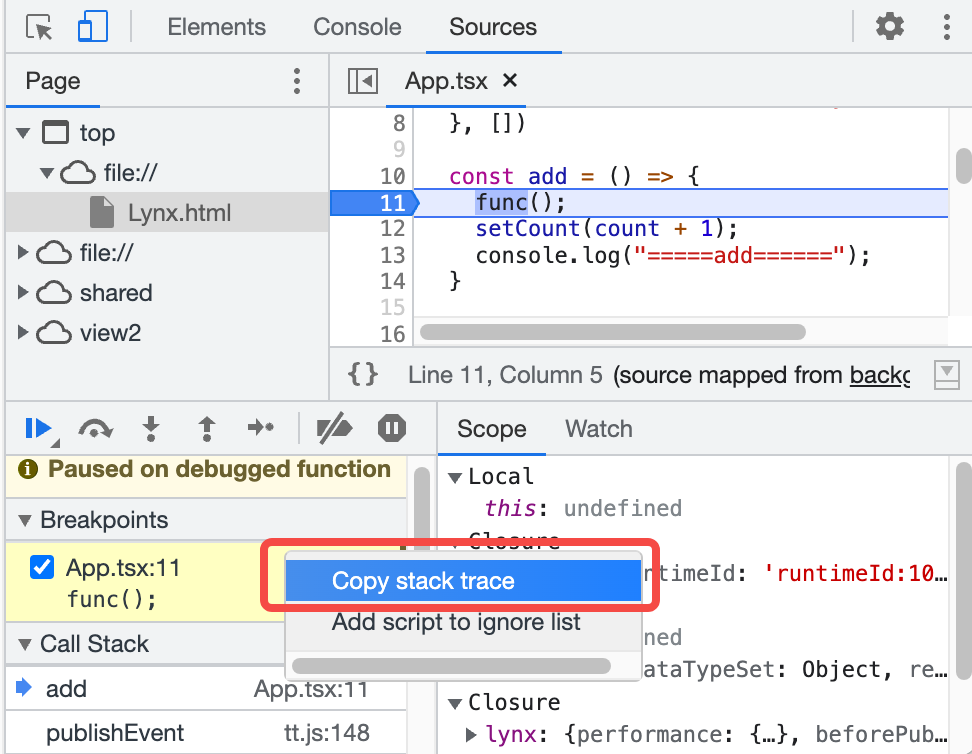
For example, in this case, the copied stack trace is as follows:
Ignore Scripts Background V8 Only
Ignore certain scripts during debugging to skip them. When ignored, scripts will be hidden in the Call stack pane, and you will never step into functions from ignored scripts while stepping through code.
Ignore a Script from the Editor Pane
Please refer to Ignore a script from the Editor pane | Chrome DevTools.
Ignore a Script from the Call Stack Pane
Please refer to Ignore a script from the Call Stack pane | Chrome DevTools.
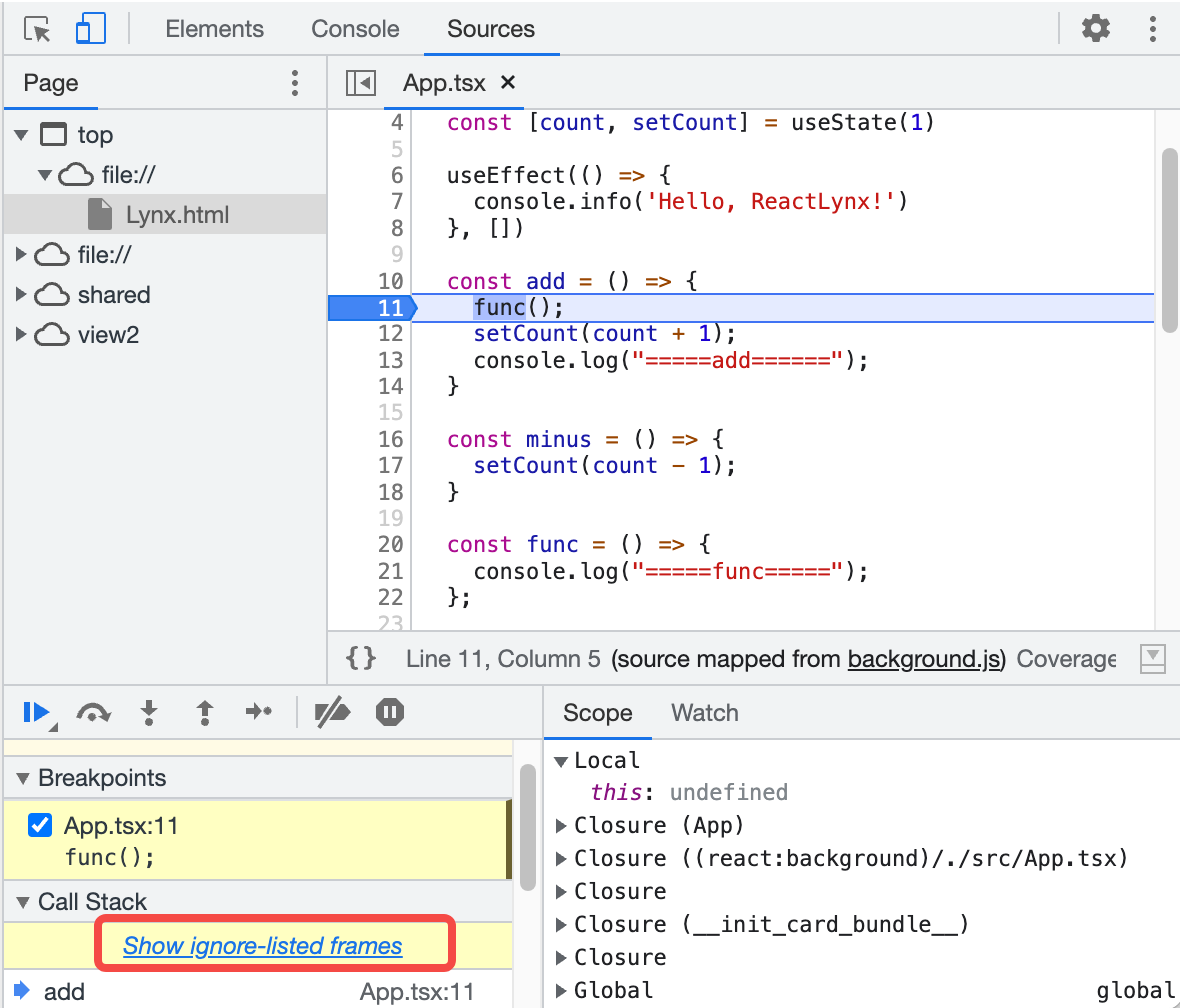
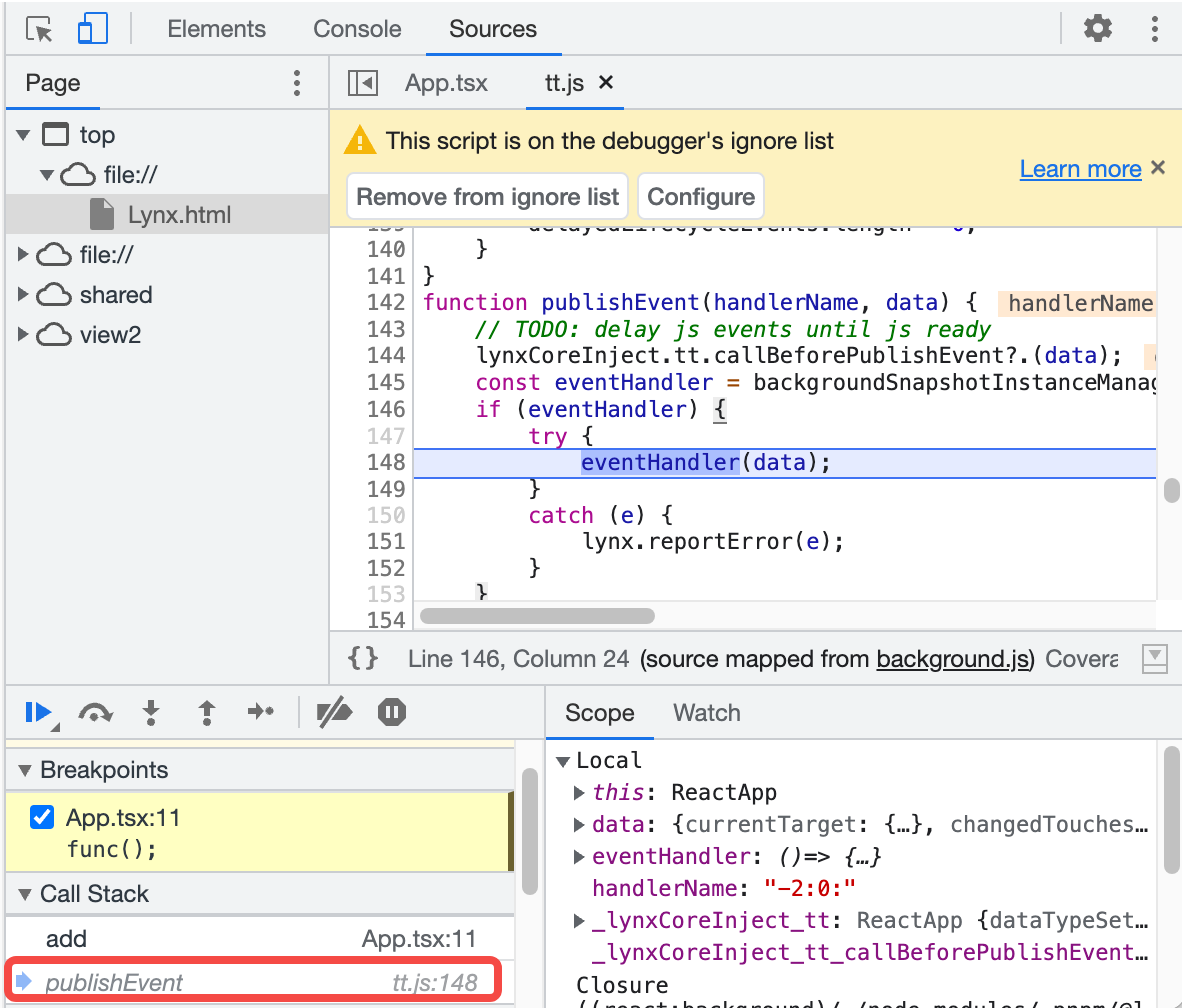
Show ignore-listed frames
If you need to view the complete call stack, click Show ignore-listed frames in the Call Stack pane. The ignored frames will be expanded but displayed in gray.
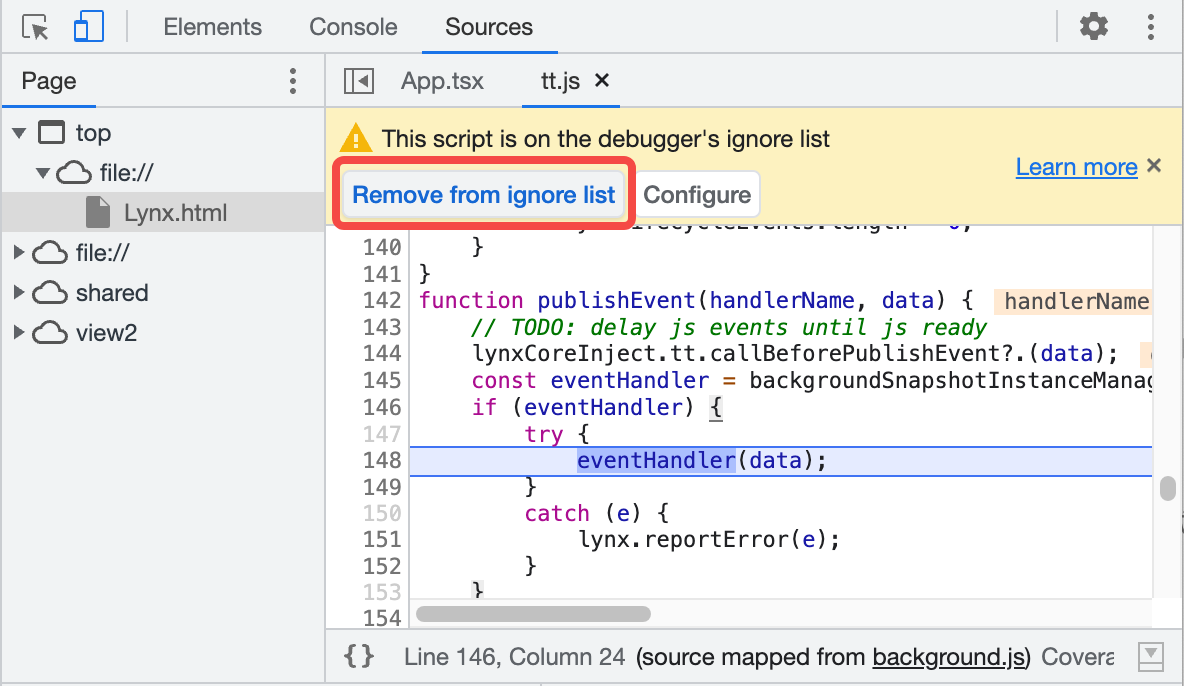
Unignore Scripts
To unignore scripts, follow the same steps as above and select Remove from ignore list.
You can also unignore scripts through the prompt at the top of the Code Editor Pane.
Watch the Values of Custom JavaScript Expressions
Please refer to Watch the values of custom JavaScript expressions | Chrome DevTools.
Inspect and Edit Scripts
In the Code Editor Pane, you can browse and edit code.
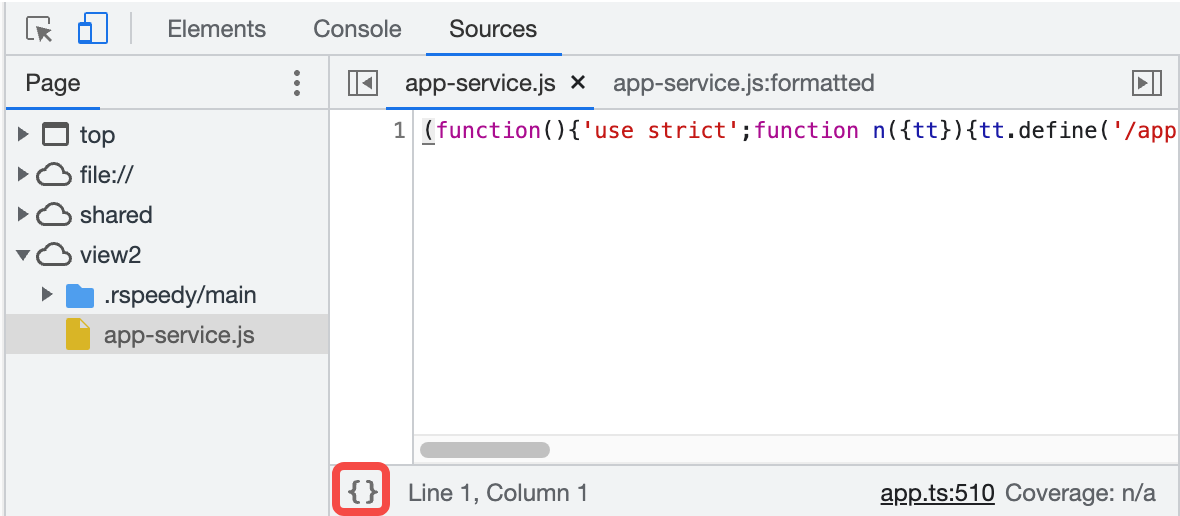
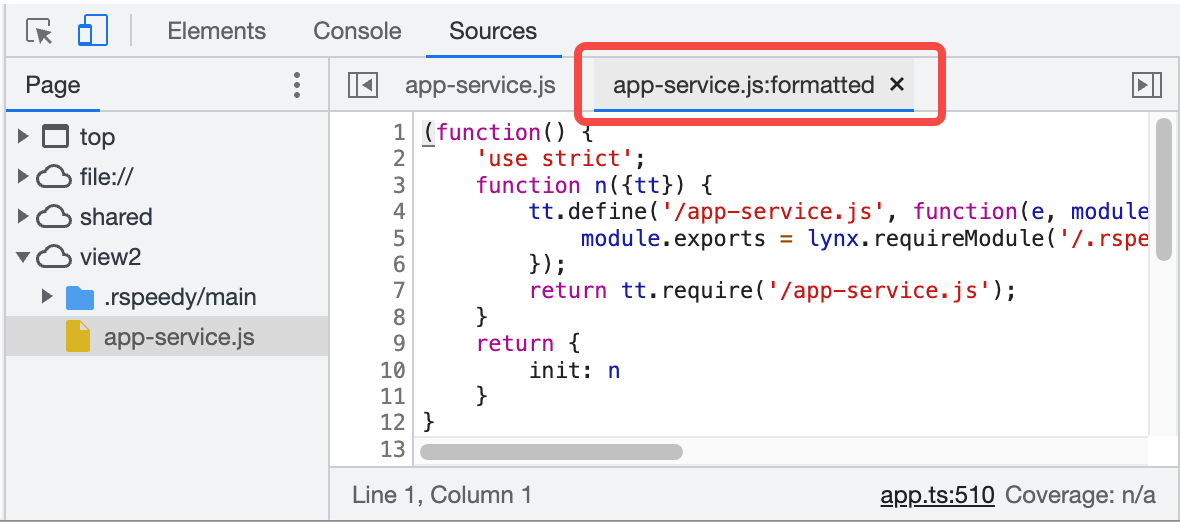
Make Minified Files Readable
Click the {} button in the bottom status bar of the editor, and the Sources panel will present the minified file in a more readable format to improve readability.
Edit Scripts Background V8 Only
Please refer to Edit a script | Chrome DevTools.
You can only modify compiled JavaScript files. The original files reversed through SourceMap cannot be modified, and changes will not be saved after reloading the page.
Search and Replace Text in Scripts
Please refer to Search and replace text in a script | Chrome DevTools.
After replacing, you need to manually save the script, as referenced in Edit Scripts.
Debug Original Code with Source Maps Background Only
After configuring SourceMap, you can directly debug the original code you author in the Sources panel.
Check If Source Maps Loaded Successfully
Check Load Status
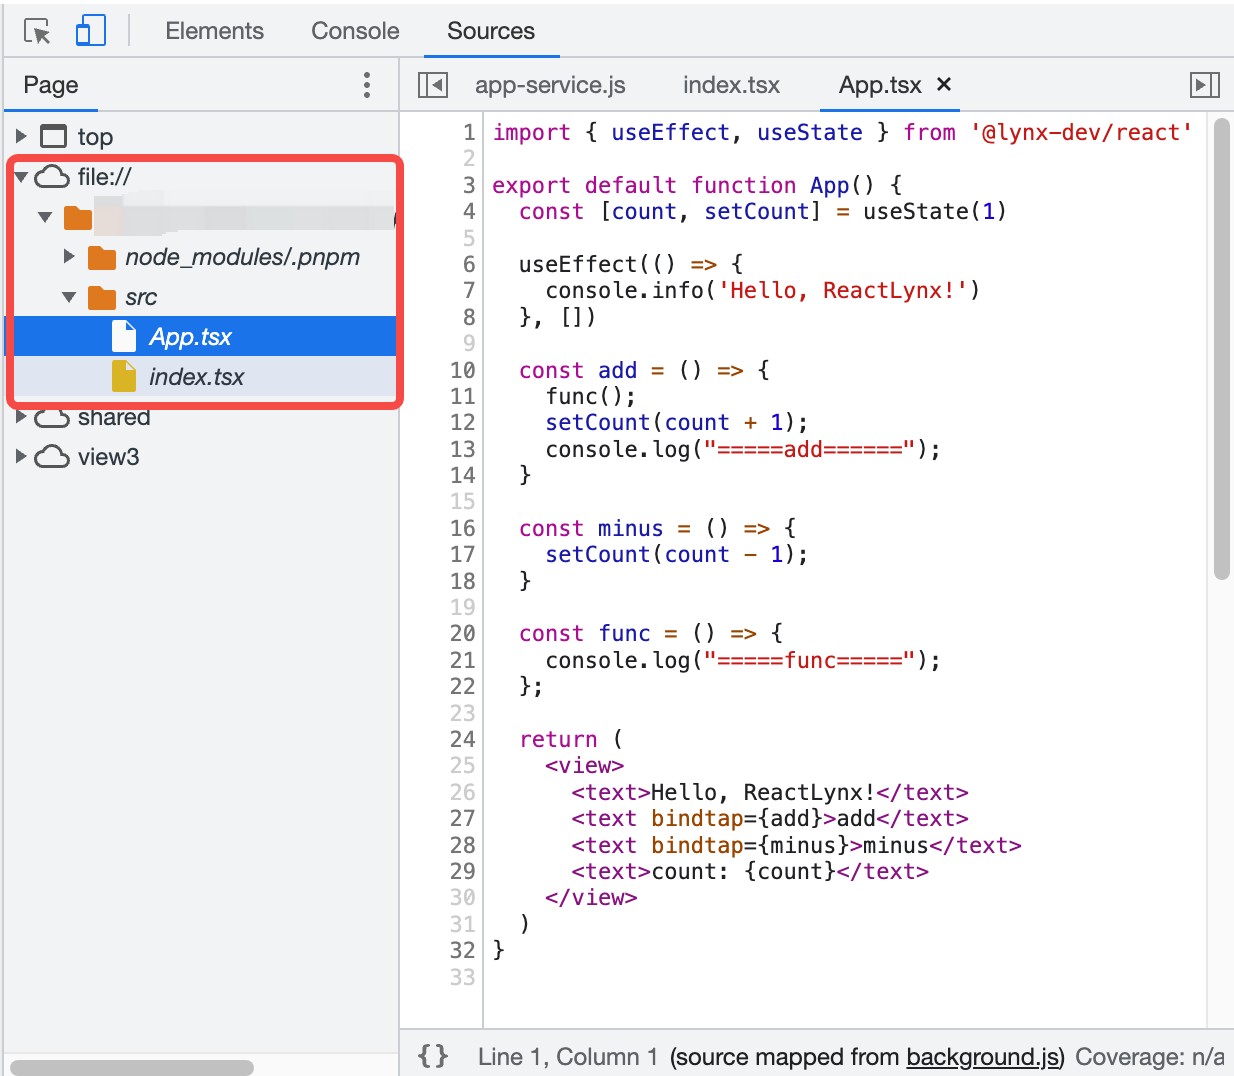
When you open DevTool, it attempts to load source maps, if any.
After loading successfully, the files in the File Navigator Pane with orange folders are the original source files.
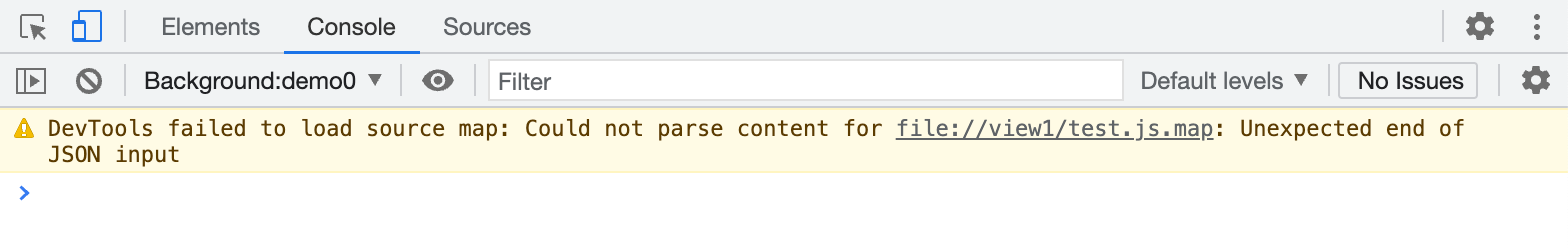
If loading fails, the Console logs an error similar to the following.
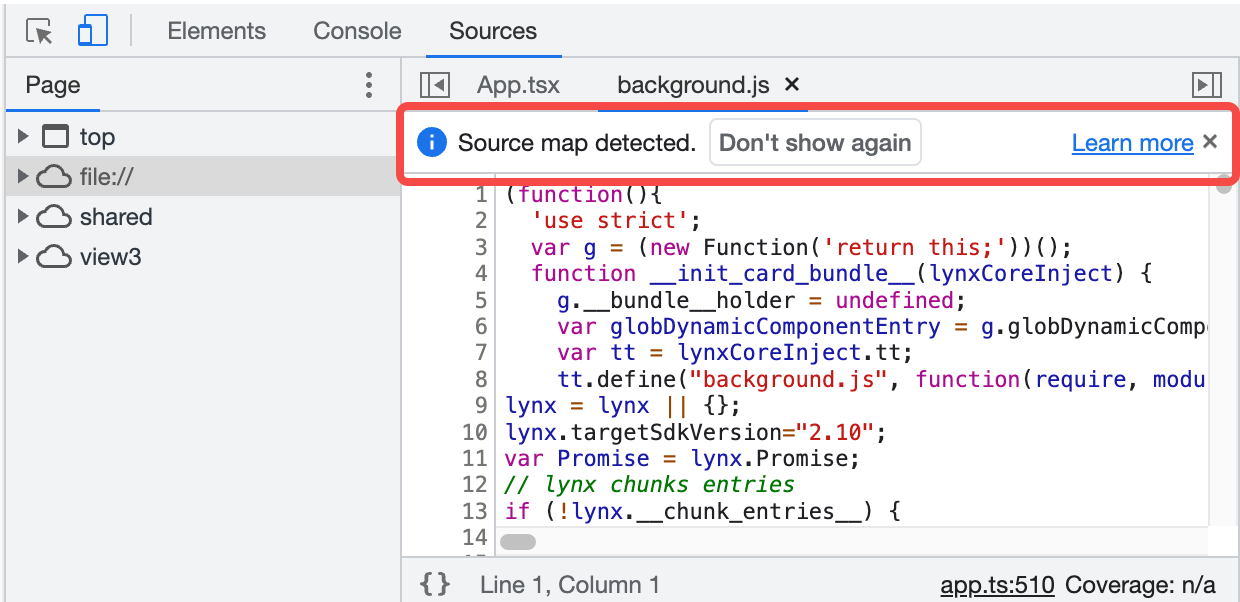
When you open any compiled file, DevTool will notify you if it found the source map.
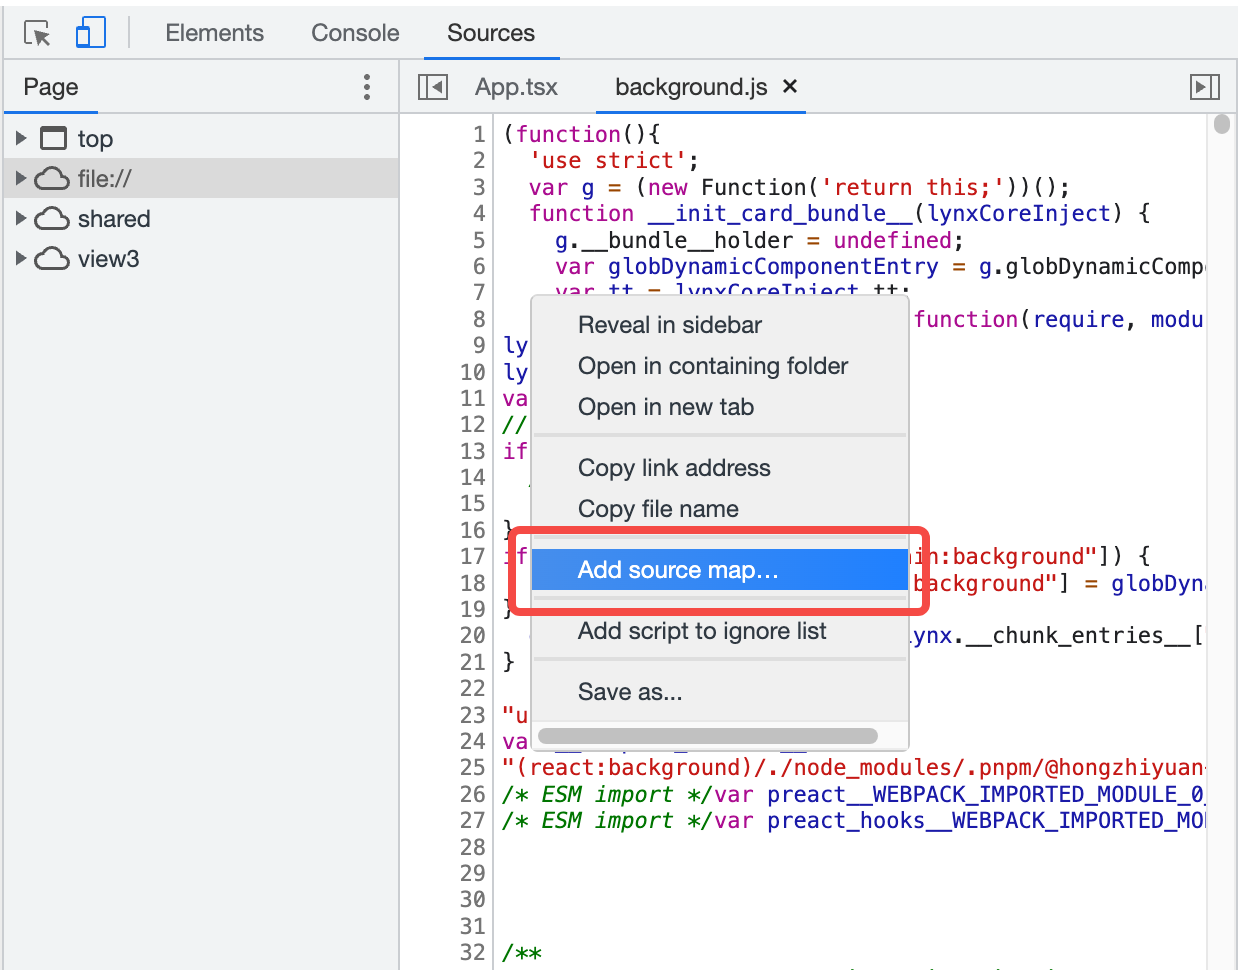
Load a Source Map Manually
You can manually load a source map:
- Open the compiled file, right-click anywhere in the Code Editor Pane, and select Add source map.
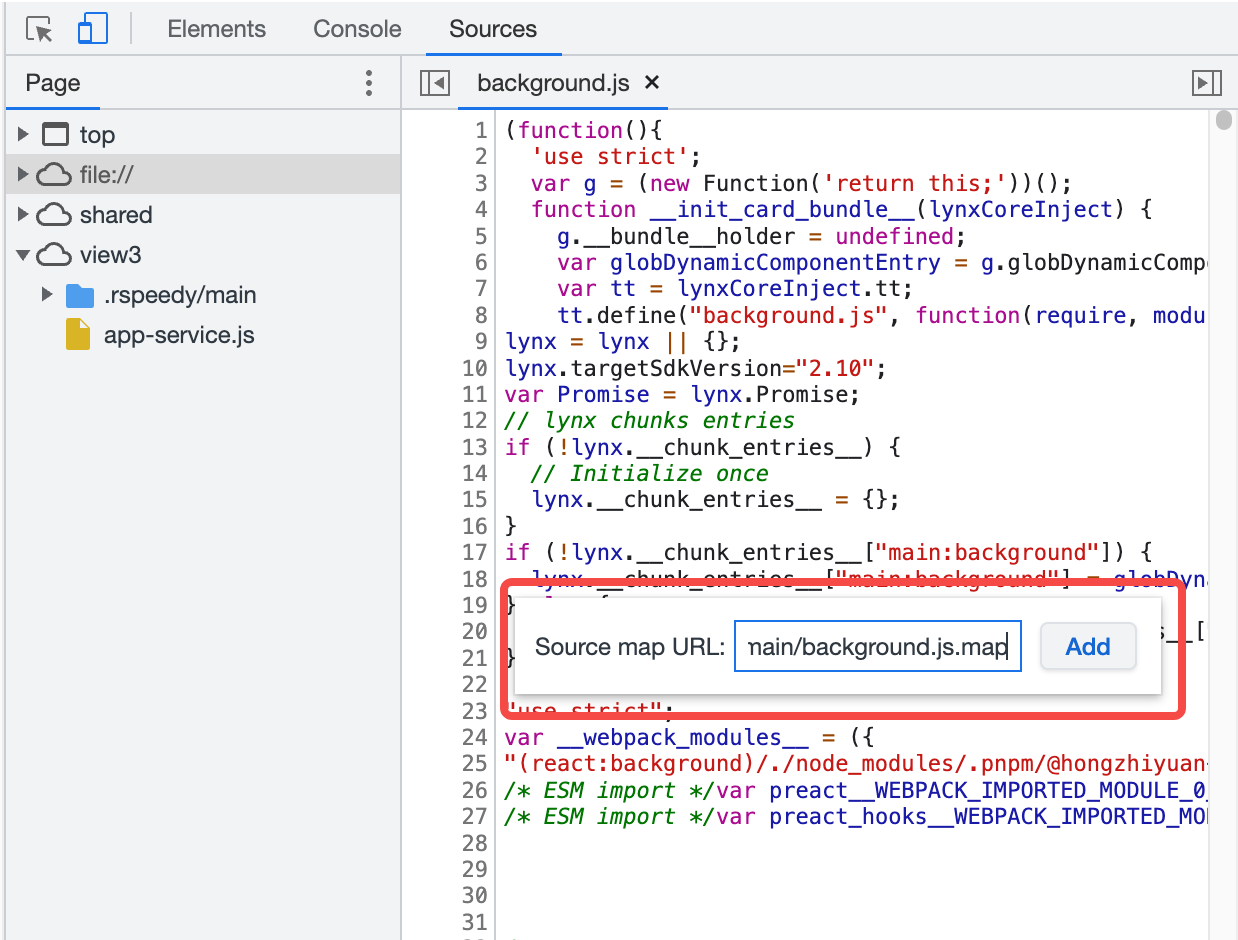
- Enter the source map URL in the textbox, then click Add.
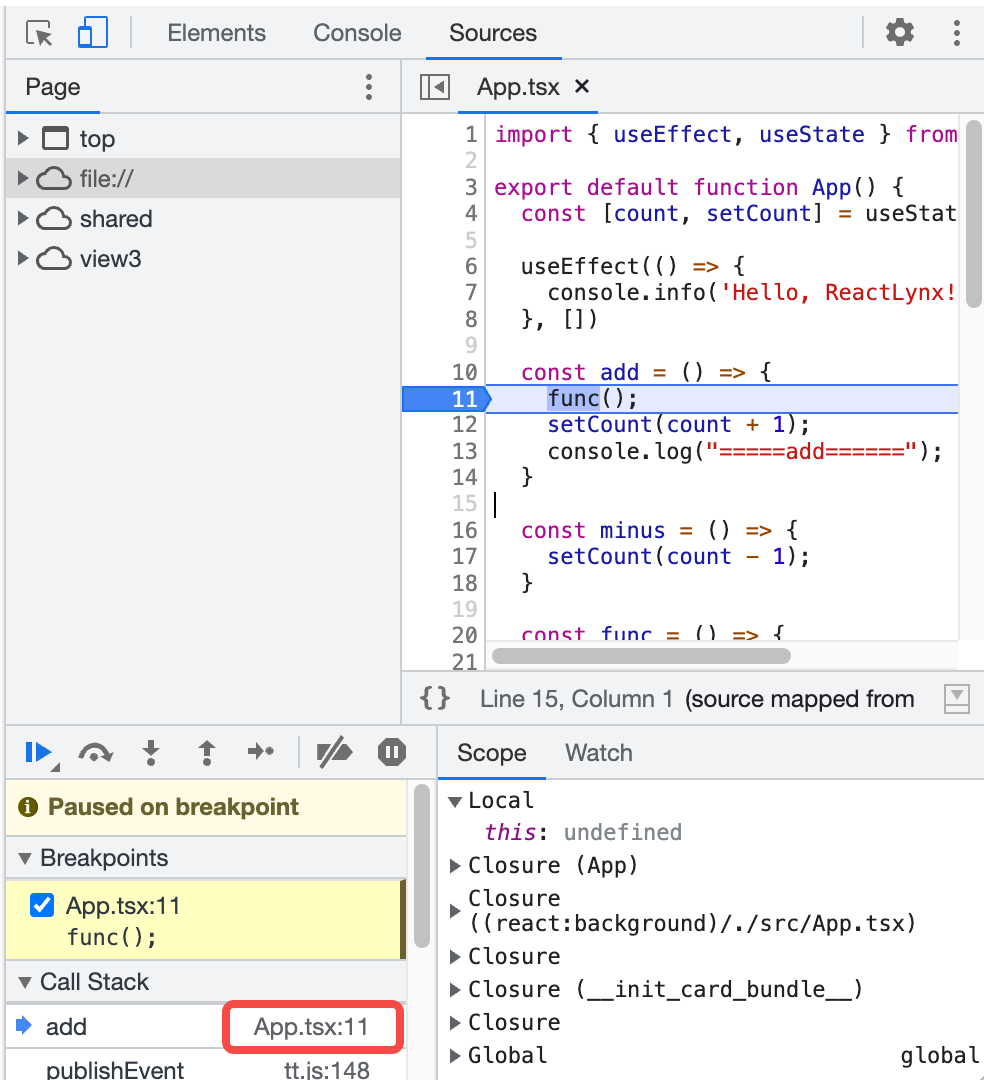
Debug with Source Maps
- In the original file, you can set breakpoints as you normally would, or you can set breakpoints in the compiled file, and DevTool will automatically jump to the original file.
- After triggering a breakpoint and pausing, the Call Stack pane will display the name of the original file.
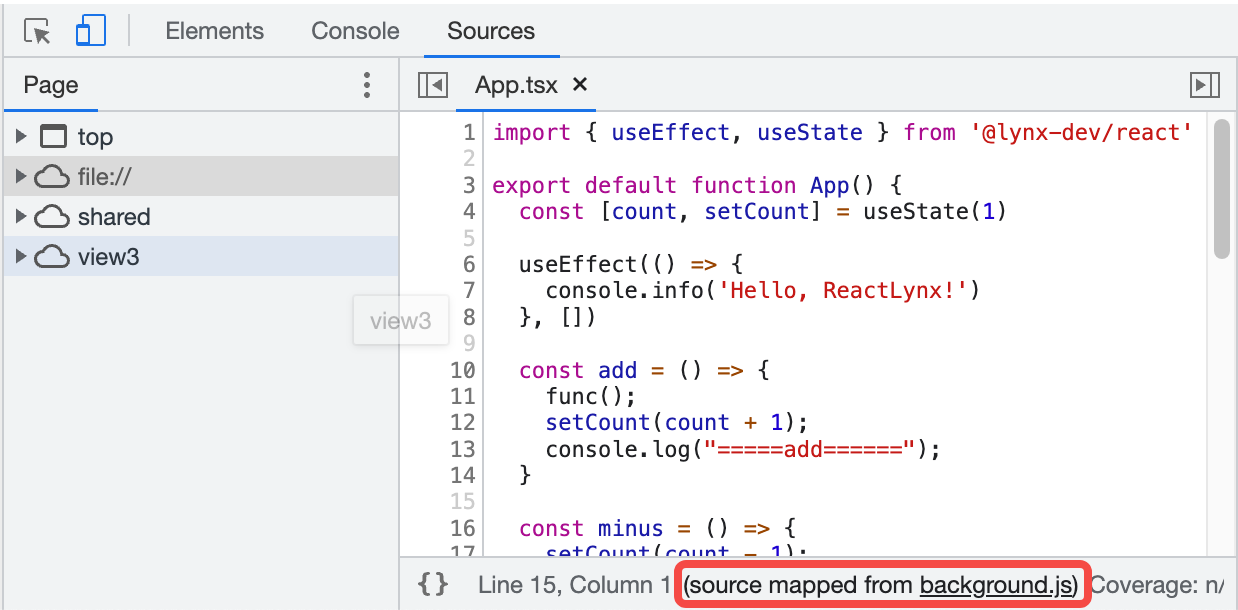
- The bottom status bar of the Code Editor Pane will show a link to the compiled file it points to. Click it to jump to the corresponding file.
Debug the Main Thread
Debugging the main thread is similar to debugging the background thread, but it requires some additional steps to enable.
Preparation
To debug the main thread, you need to start the project in dev mode using rspeedy.
You can check the following two items to ensure preparation is done:
- A
debug-info.jsonfile is generated in the intermediate output directory.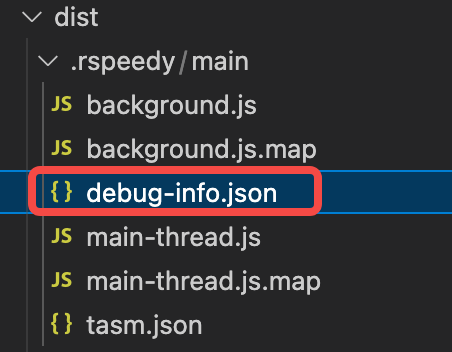
- In the
tasm.jsonfile of the intermediate output directory, thetemplateDebugUrlfield is a valid URL pointing to thedebug-info.jsonfile mentioned in step one. Refer to rspeedy.dev.assetprefix.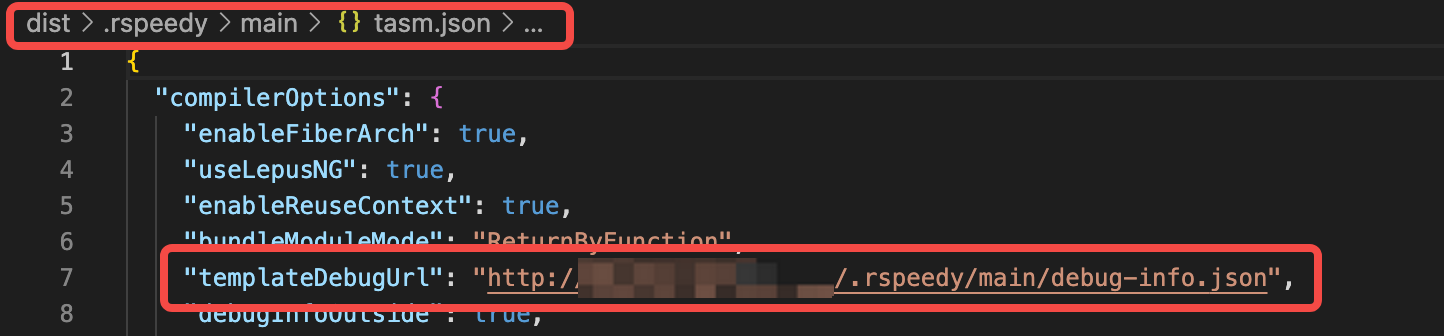
Enable Main Thread Debugging
Hover over the position shown in the image below, then enable Main Thread Debugging. This is a non-persistent global switch that takes effect for all pages during a single APP run. The switch state will be reset after closing and restarting the APP.
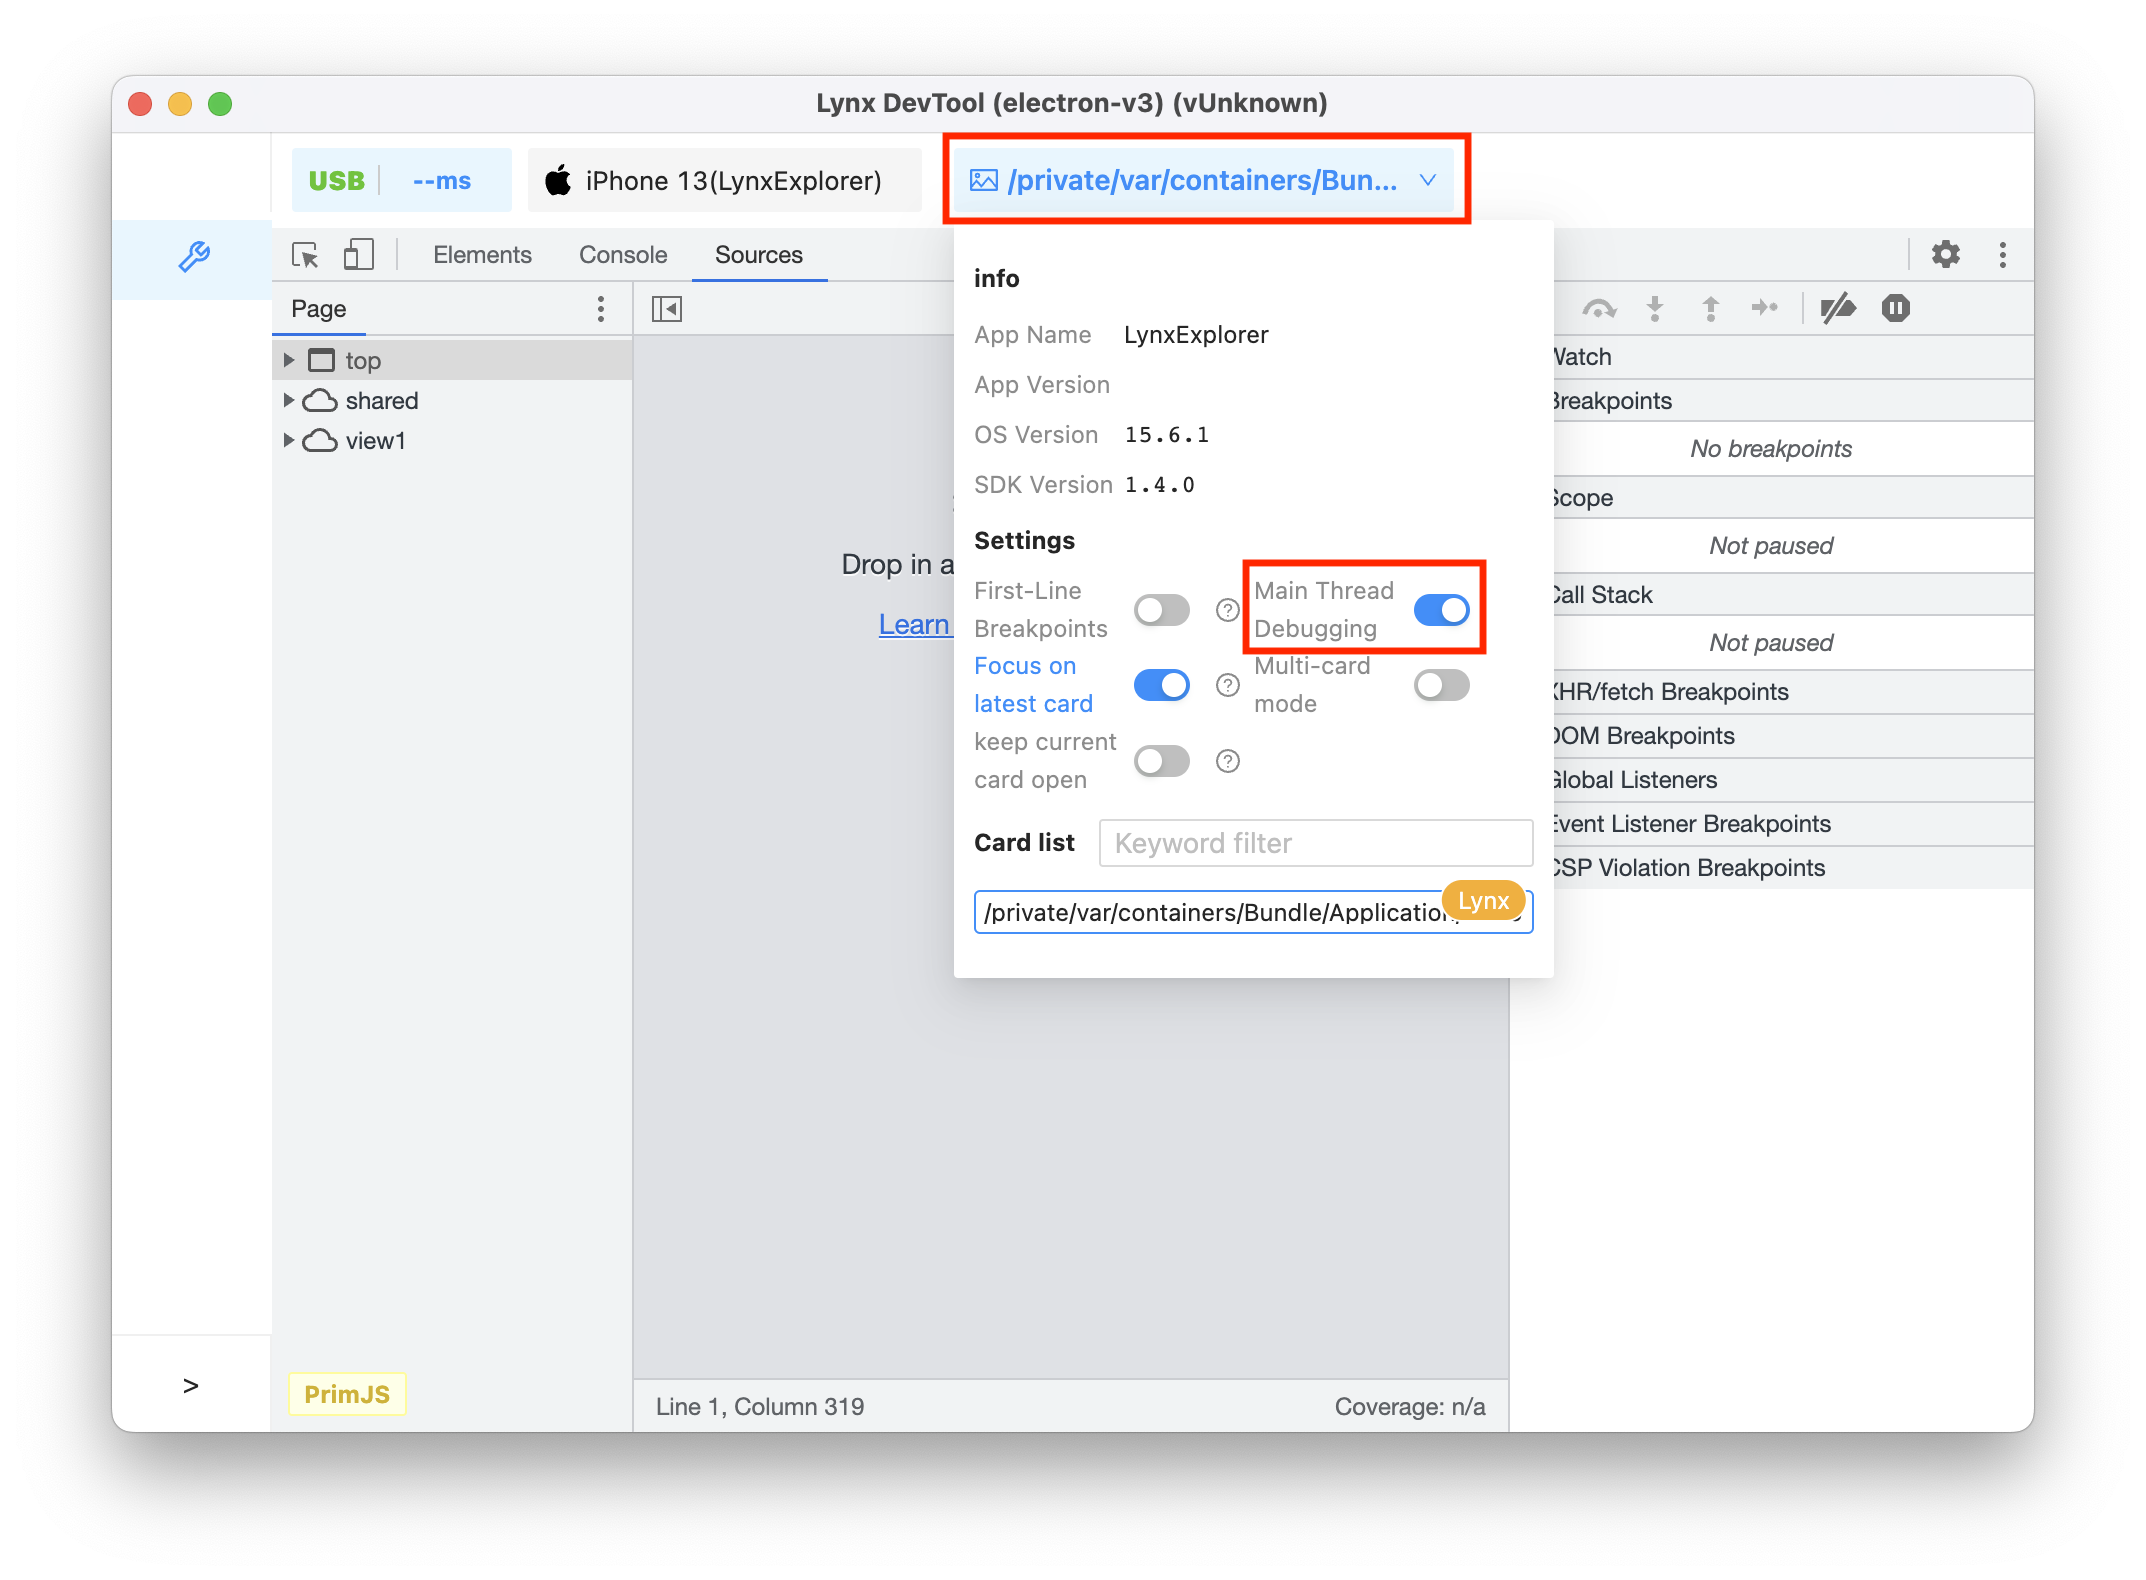
To enable main thread debugging:
- Turn on the switch, then open the page you want to debug. Or open the page you want to debug, turn on the switch, and then reload the page.
- The
main-thread.jsfile of the main thread will be displayed in the File Navigator Pane (formerly known aslepus.js). - In the Threads pane, switch to Main to start debugging.
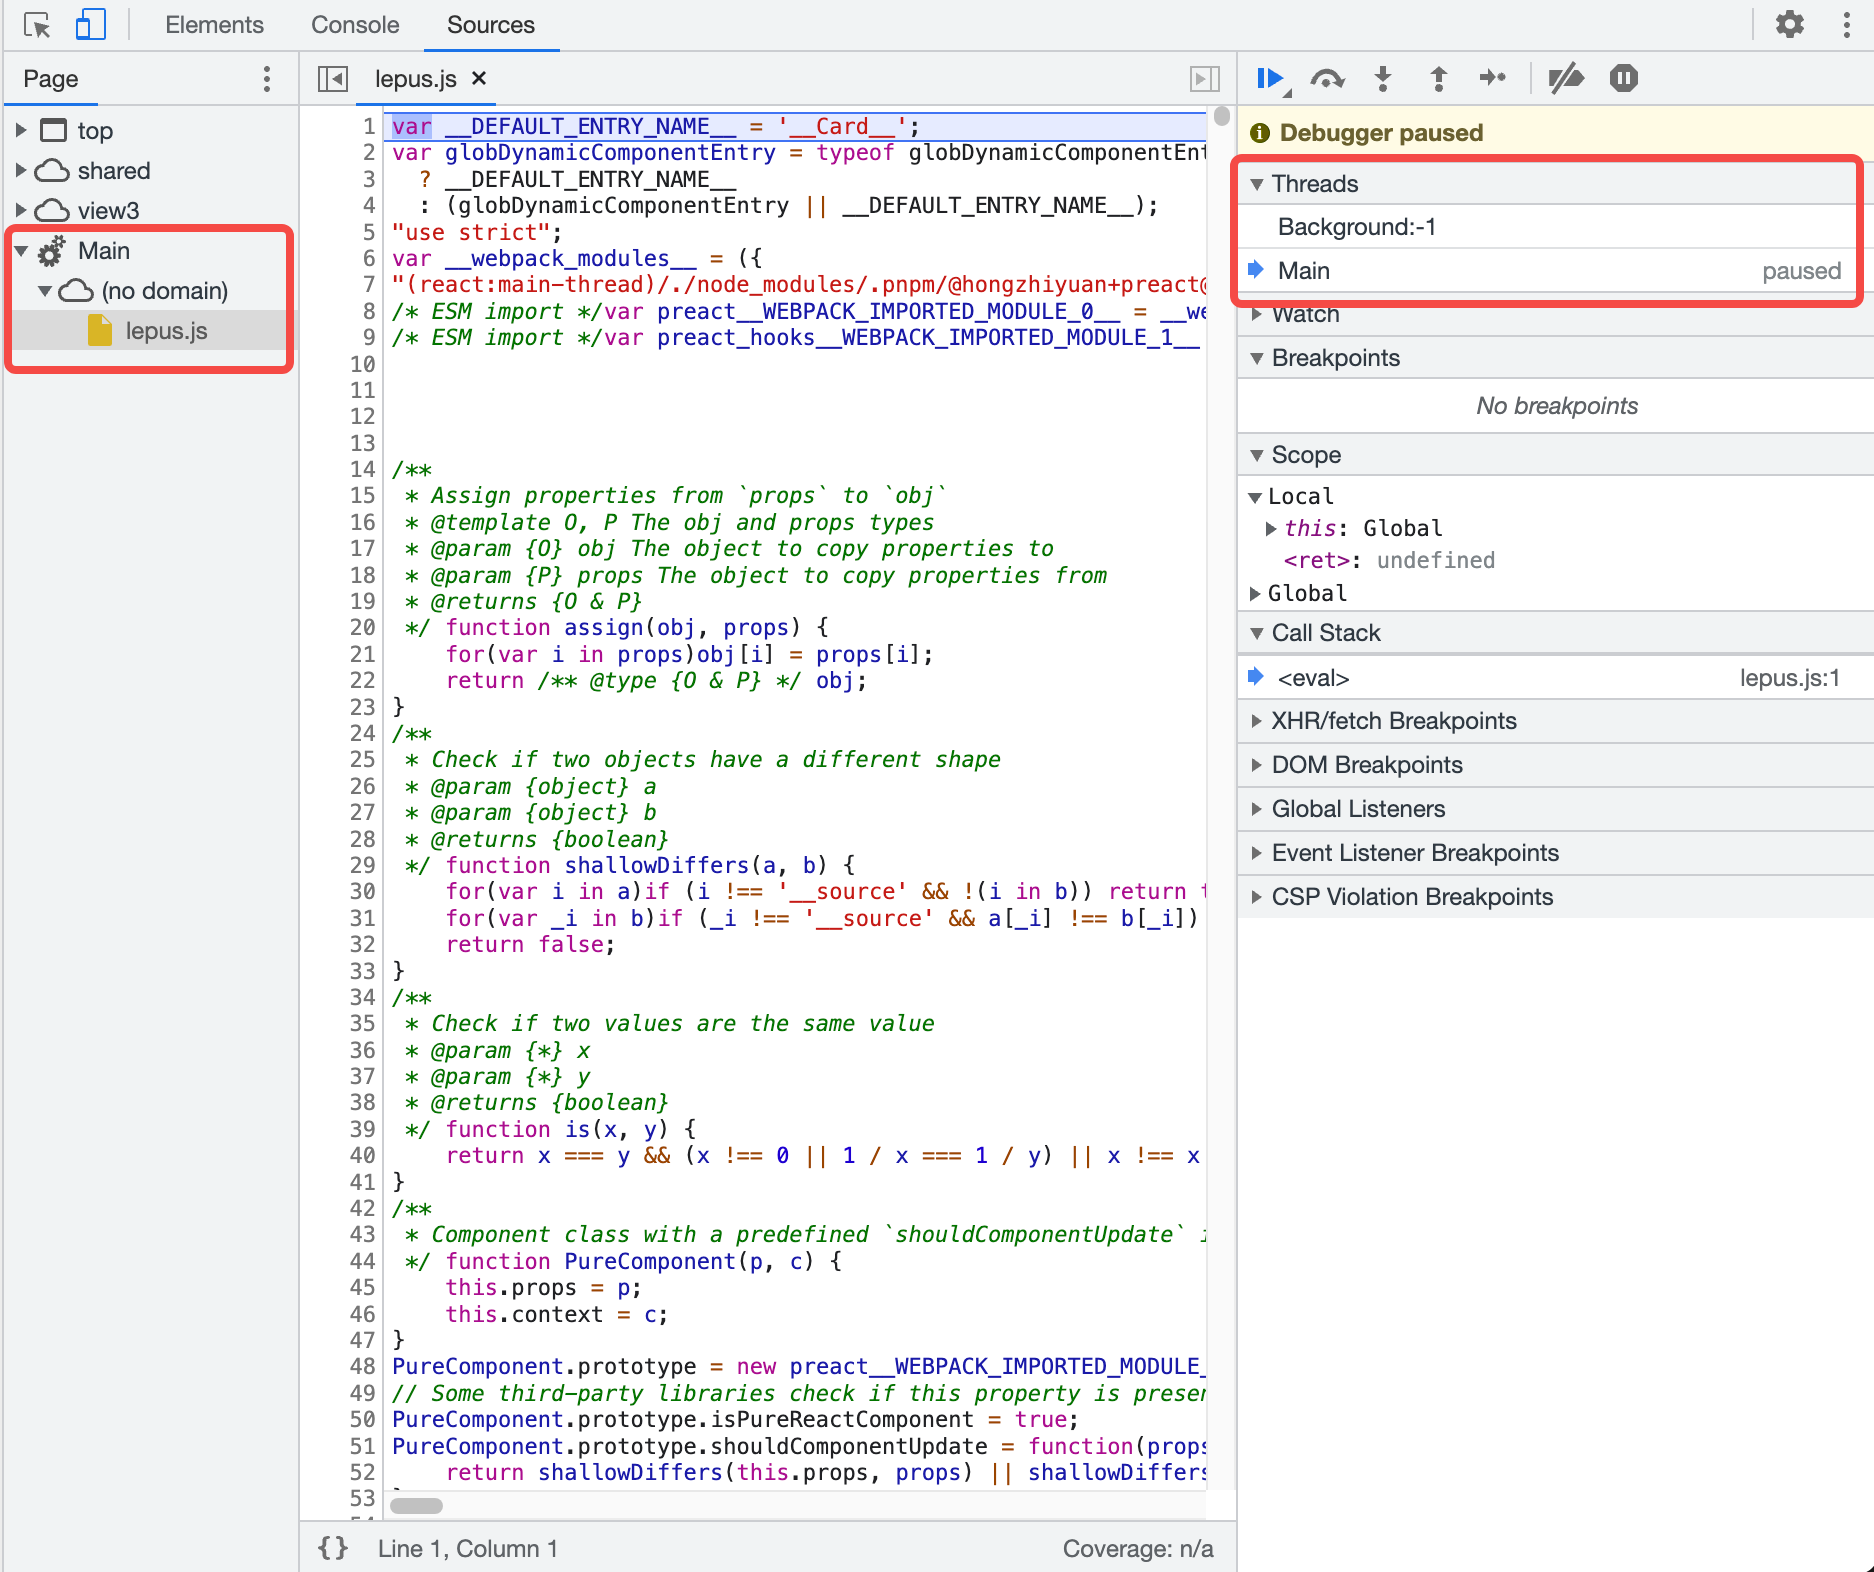
In the Threads pane, you can switch between debugging the main thread or the background thread. The blue arrow icon represents which context is selected. The currently paused thread will be marked as paused.