Evaluating Performane
The performance of the Lynx page can determine users' perceptions of your application. Lynx provides the Performance API to help you monitor the status of the page and accurately measure its performance during operation.
Evaluating User Perceived Performance
It is critical to understand that User Perceived Performance (UPP) reflects users' subjective experience of page responsiveness. When opening a page, users typically expect immediate content visibility rather than waiting through a blank screen. To enhance this perception, two fundamental principles apply: Show Content Early and Quick Response.
-
Show Content Early: While loading a page, prioritize displaying partial content (e.g., skeleton screens, loading animations) instead of waiting for full data readiness. This reduces perceived wait time by providing immediate visual feedback.
-
Quick Response: When user actions trigger operations that take time (such as searching or image processing), display a loading animation immediately. Although this doesn't change the actual completion time, it gives users the impression that the page responded timely to their actions.
These principles reduce user abandonment caused by perceived unresponsiveness. However, since UPP involves complex subjective experiences, it's challenging to rely on a single metric for evaluation. Instead, a comprehensive assessment using multiple metrics provided by the Performance API is necessary:
-
First Contentful Paint (FCP): Time to first content rendering completion.
-
Actual First Meaningful Paint (ActualFMP): Time to rendering of truly meaningful content.
Based on the aforementioned metrics, if a page can immediately display primary content after loading (LoadBundle) without requiring additional data fetches to render, prioritize optimizing FCP.

Conversely, if page rendering depends on additional data — such as asynchronous fetches via network requests or local file reads — to achieve "actual" content display, you can mark the Lynx pipeline to track this critical data update. By annotating the Lynx Pipeline, developers can track critical data updates and measure the resulting ActualFMP. Unlike scenarios without data dependencies, FCP in such cases may only show non-meaningful UI states (e.g., loading animations or skeleton screens).

This highlights a conflict: rendering real data requires additional processing time, which contradicts the goal of improving UPP. To optimize perceived performance, prioritize static or preloaded content for the initial screen, while deferring network-dependent content to subsequent updates. Although this approach may increases total data transfer, it significantly enhances user perceived performance by rendering meaningful content earlier.
Evaluating Application Runtime Performance
While perceived speed (UPP) drives user satisfaction, Application Runtime Performance (ARP) determines technical efficiency in resource preparation and rendering.
ARP evaluation focuses on two phases: initialize and render. Both phases dictate how quickly users can interact with the application. Poor performance may cause users to abandon accessing the page content or even be unable to access the content at all.
Initialize
From the moment a user clicks a link to the display of a new page, an application needs to complete preparatory tasks, including initializing the page container and preparing the TemplateBundle.
The initialization phase includes three key steps: Container setup, LynxView
creation, and Background Thread Runtime preparation. The Performance API provides
InitContainerEntry, InitLynxviewEntry,
and InitBackgroundRuntimeEntry to describe these key moments. You can
combine these performance entries to analyze the entire initialization phase.

Although these preparations occur before the page rendering, their performance directly impacts the user experience. Slow initialization delays rendering, increasing user wait time and negatively impacting perceived performance. To minimize loading time as much as possible, you can advance these initialization tasks by using local caching, preloading TemplateBundle, and pre-creating LynxView, ensuring immediate response.
Render
The rendering phase begins post-load and directly controls content visibility speed. To manage each step precisely, Lynx uses the Lynx pipeline to divide the rendering
process into several crucial stages. The Performance API provides the
PipelineEntry interface to record and analyze the specific timing of these stages.
With PipelineEntry, you can access detailed timing data during the page rendering process, such as main thread script execution time, style computation time, and layout
computation time. These detailed timing metrics help identify performance bottlenecks, enabling targeted optimization efforts.

Understanding and tracking the actual performance of a page is critical for improving the user experience. By utilizing specific performance metrics, you can identify which stages are causing delays and implement optimization strategies to ensure users see a complete, interactive page as quickly as possible. This monitoring and optimization can significantly reduce user waiting time and enhance the overall smoothness of an application.
Building Custom Performance Metrics
Custom performance metrics align with specific business objectives. Usage of the Performance API is not restricted to analyzing
page performance using built-in metrics. You can flexibly combine key moments of different PerformanceEntry to build a set
of performance metrics tailored to your application.
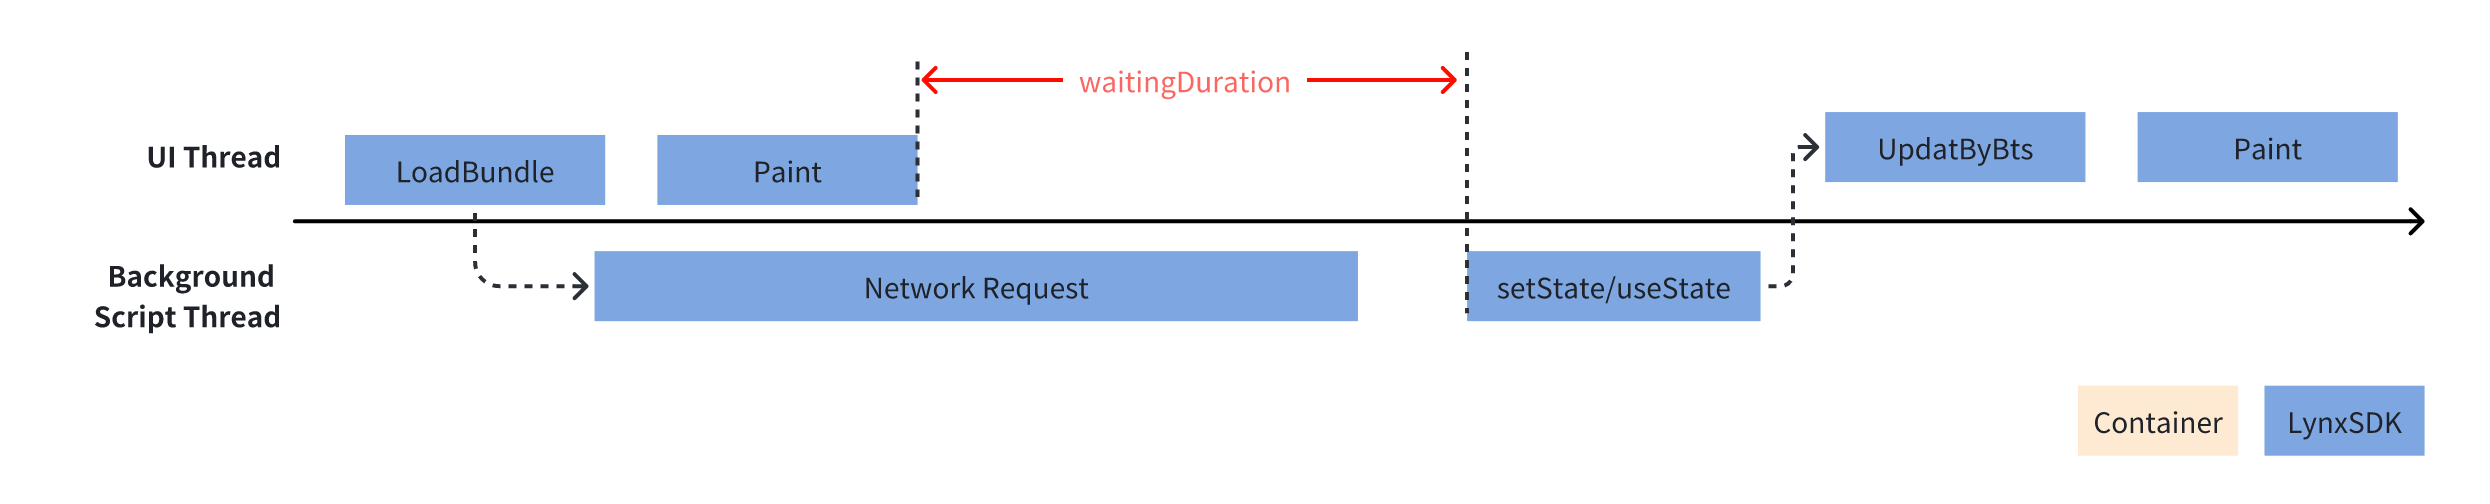
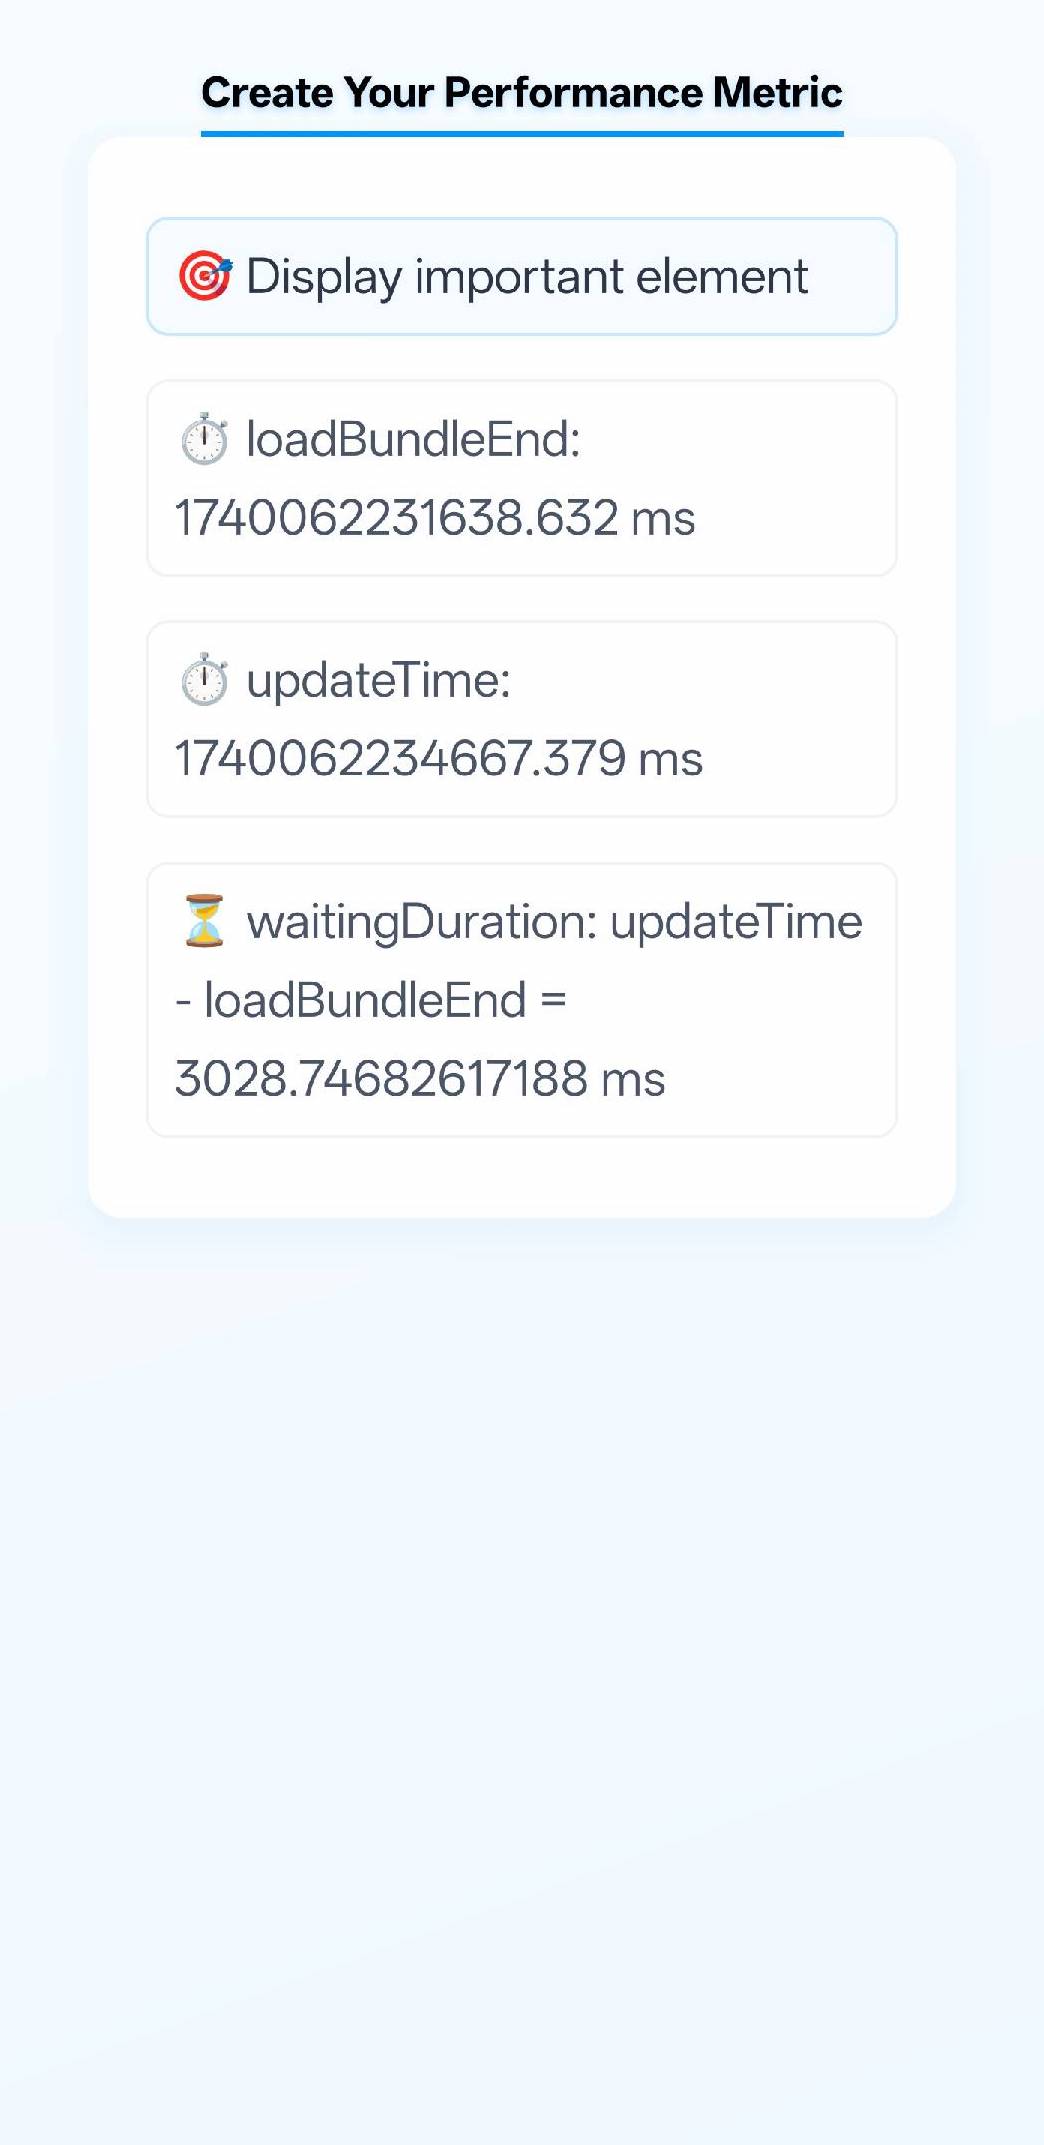
For example, if you want to focus on the delay between the end of the first-frame rendering and the end of the first significant data updates. You can combine
LoadBundleEntry and PipelineEntry
to calculate a new performance metric waitingDuration like the following code. This metric can help you monitor the speed of network requests, file reads, and other
behaviors, pinpointing the reasons for deteriorating page performance.