Preact Devtools Panel
The Preact Devtools panel helps you inspect the hierarchy of ReactLynx components, displaying information such as component props, state, and file paths. The Preact Devtools panel is based on the Preact Devtools web browser extension and offers the same user experience.
Overview
With the Preact Devtools panel, you can:
- View the component hierarchy of ReactLynx
- Modify props or state and see real-time updates
- Use ClickToComponent to navigate to component source code
- Use the Profiler to analyze application performance
Open the Preact Devtools Panel
In the DevTool window, click the Preact Devtools tab in the main panel to open it.
Note: Before using the Preact Devtools panel, you need to import @lynx-js/preact-devtools at the first line of your ReactLynx application's entry file:
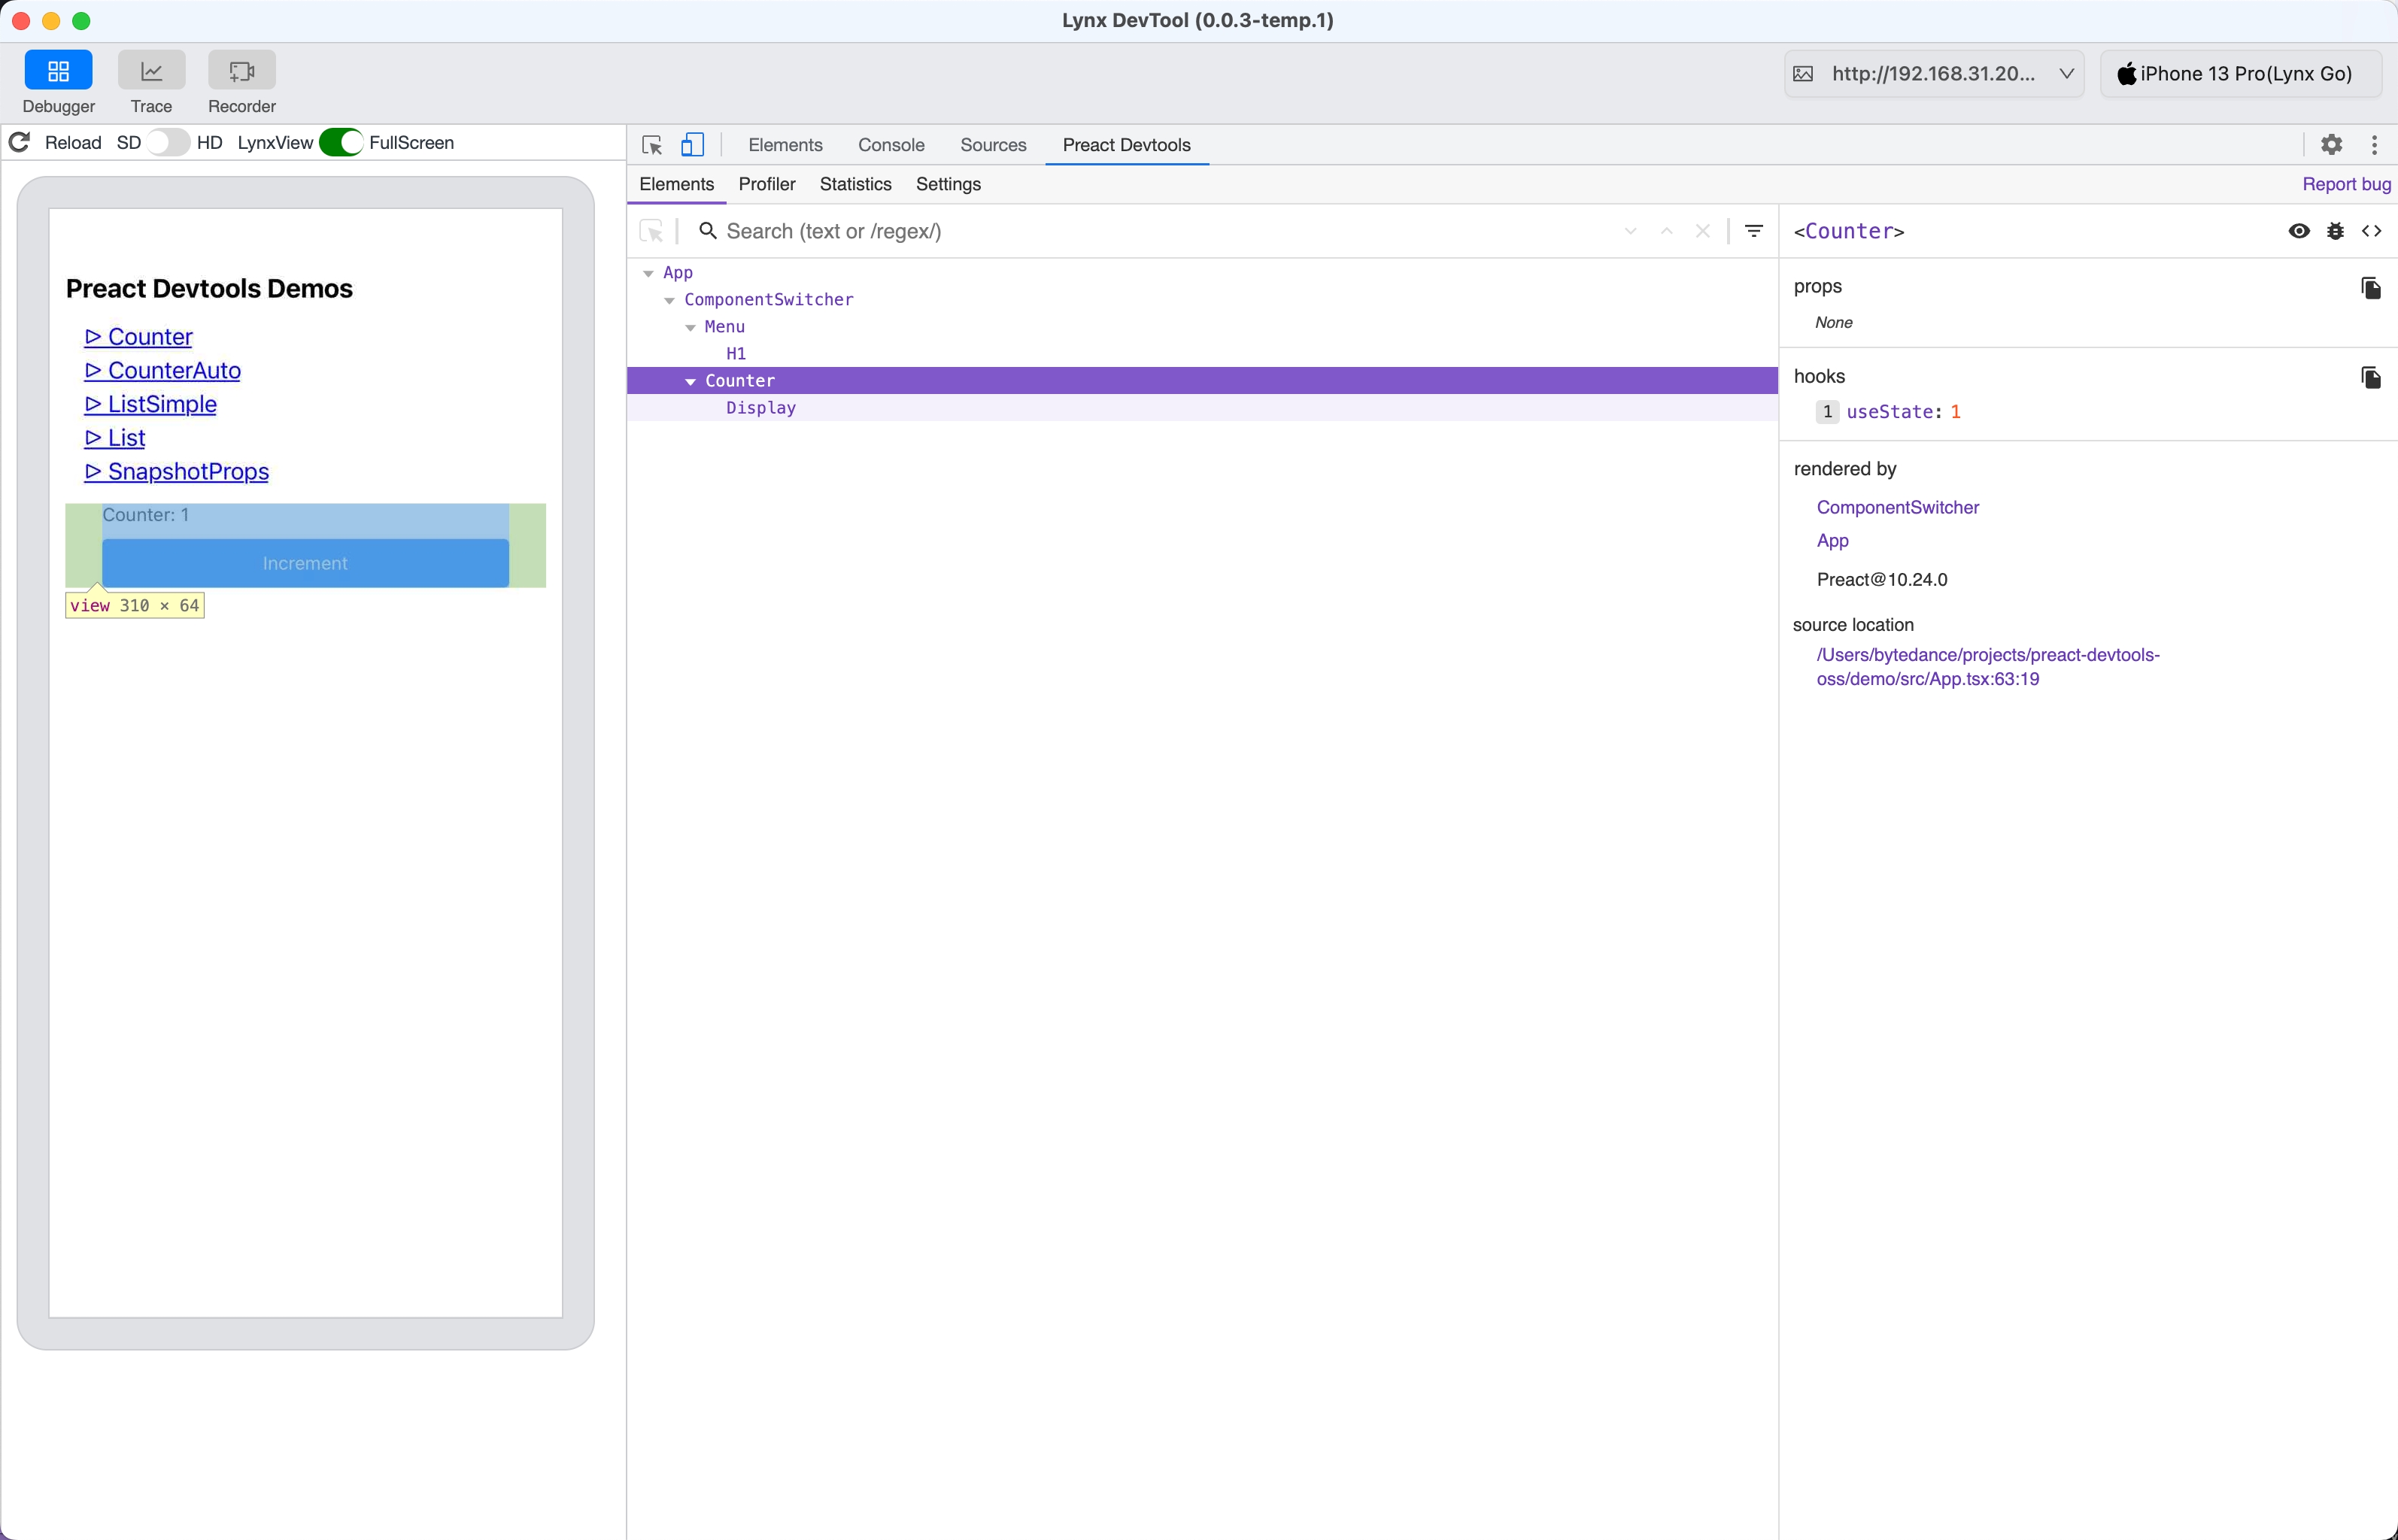
View Component Hierarchy
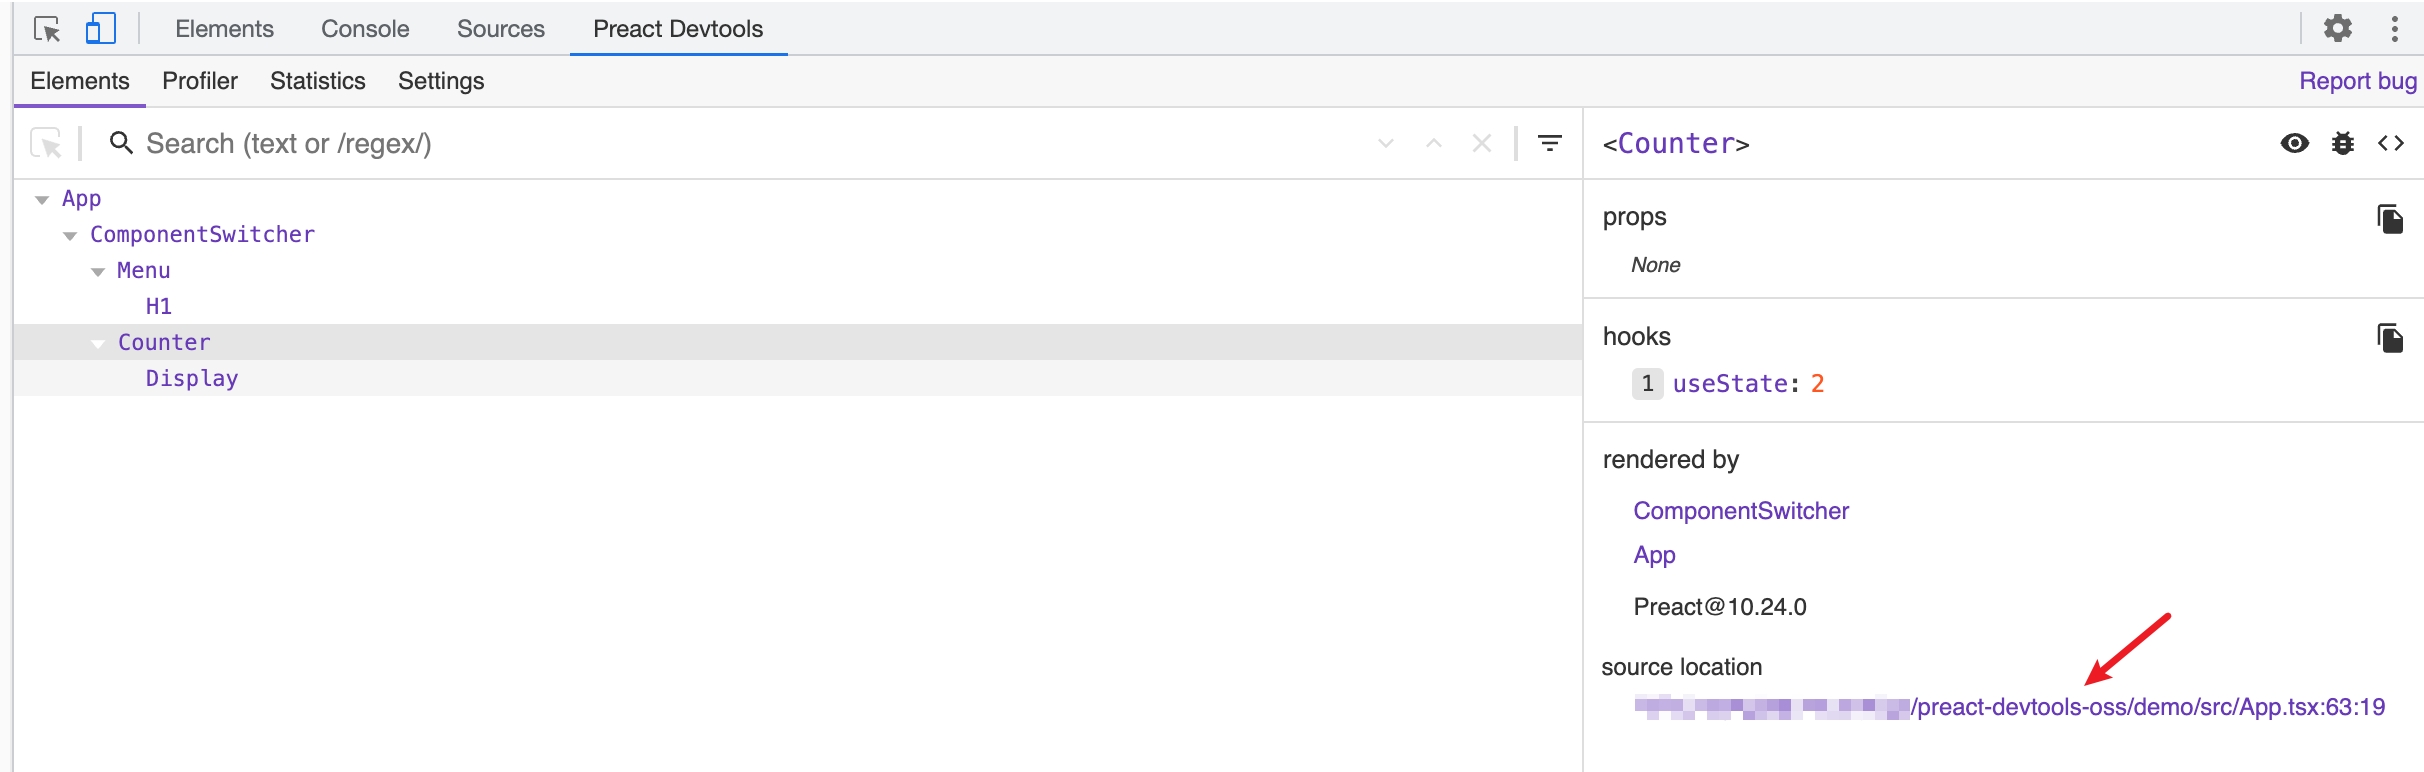
The left side of the Preact Devtools panel shows the complete hierarchy of the ReactLynx application, while the right side displays detailed information about the selected component, including its props, state, and file path.
Hover over a component to highlight its corresponding box model in the preview window on the left.
View and Modify Props or State
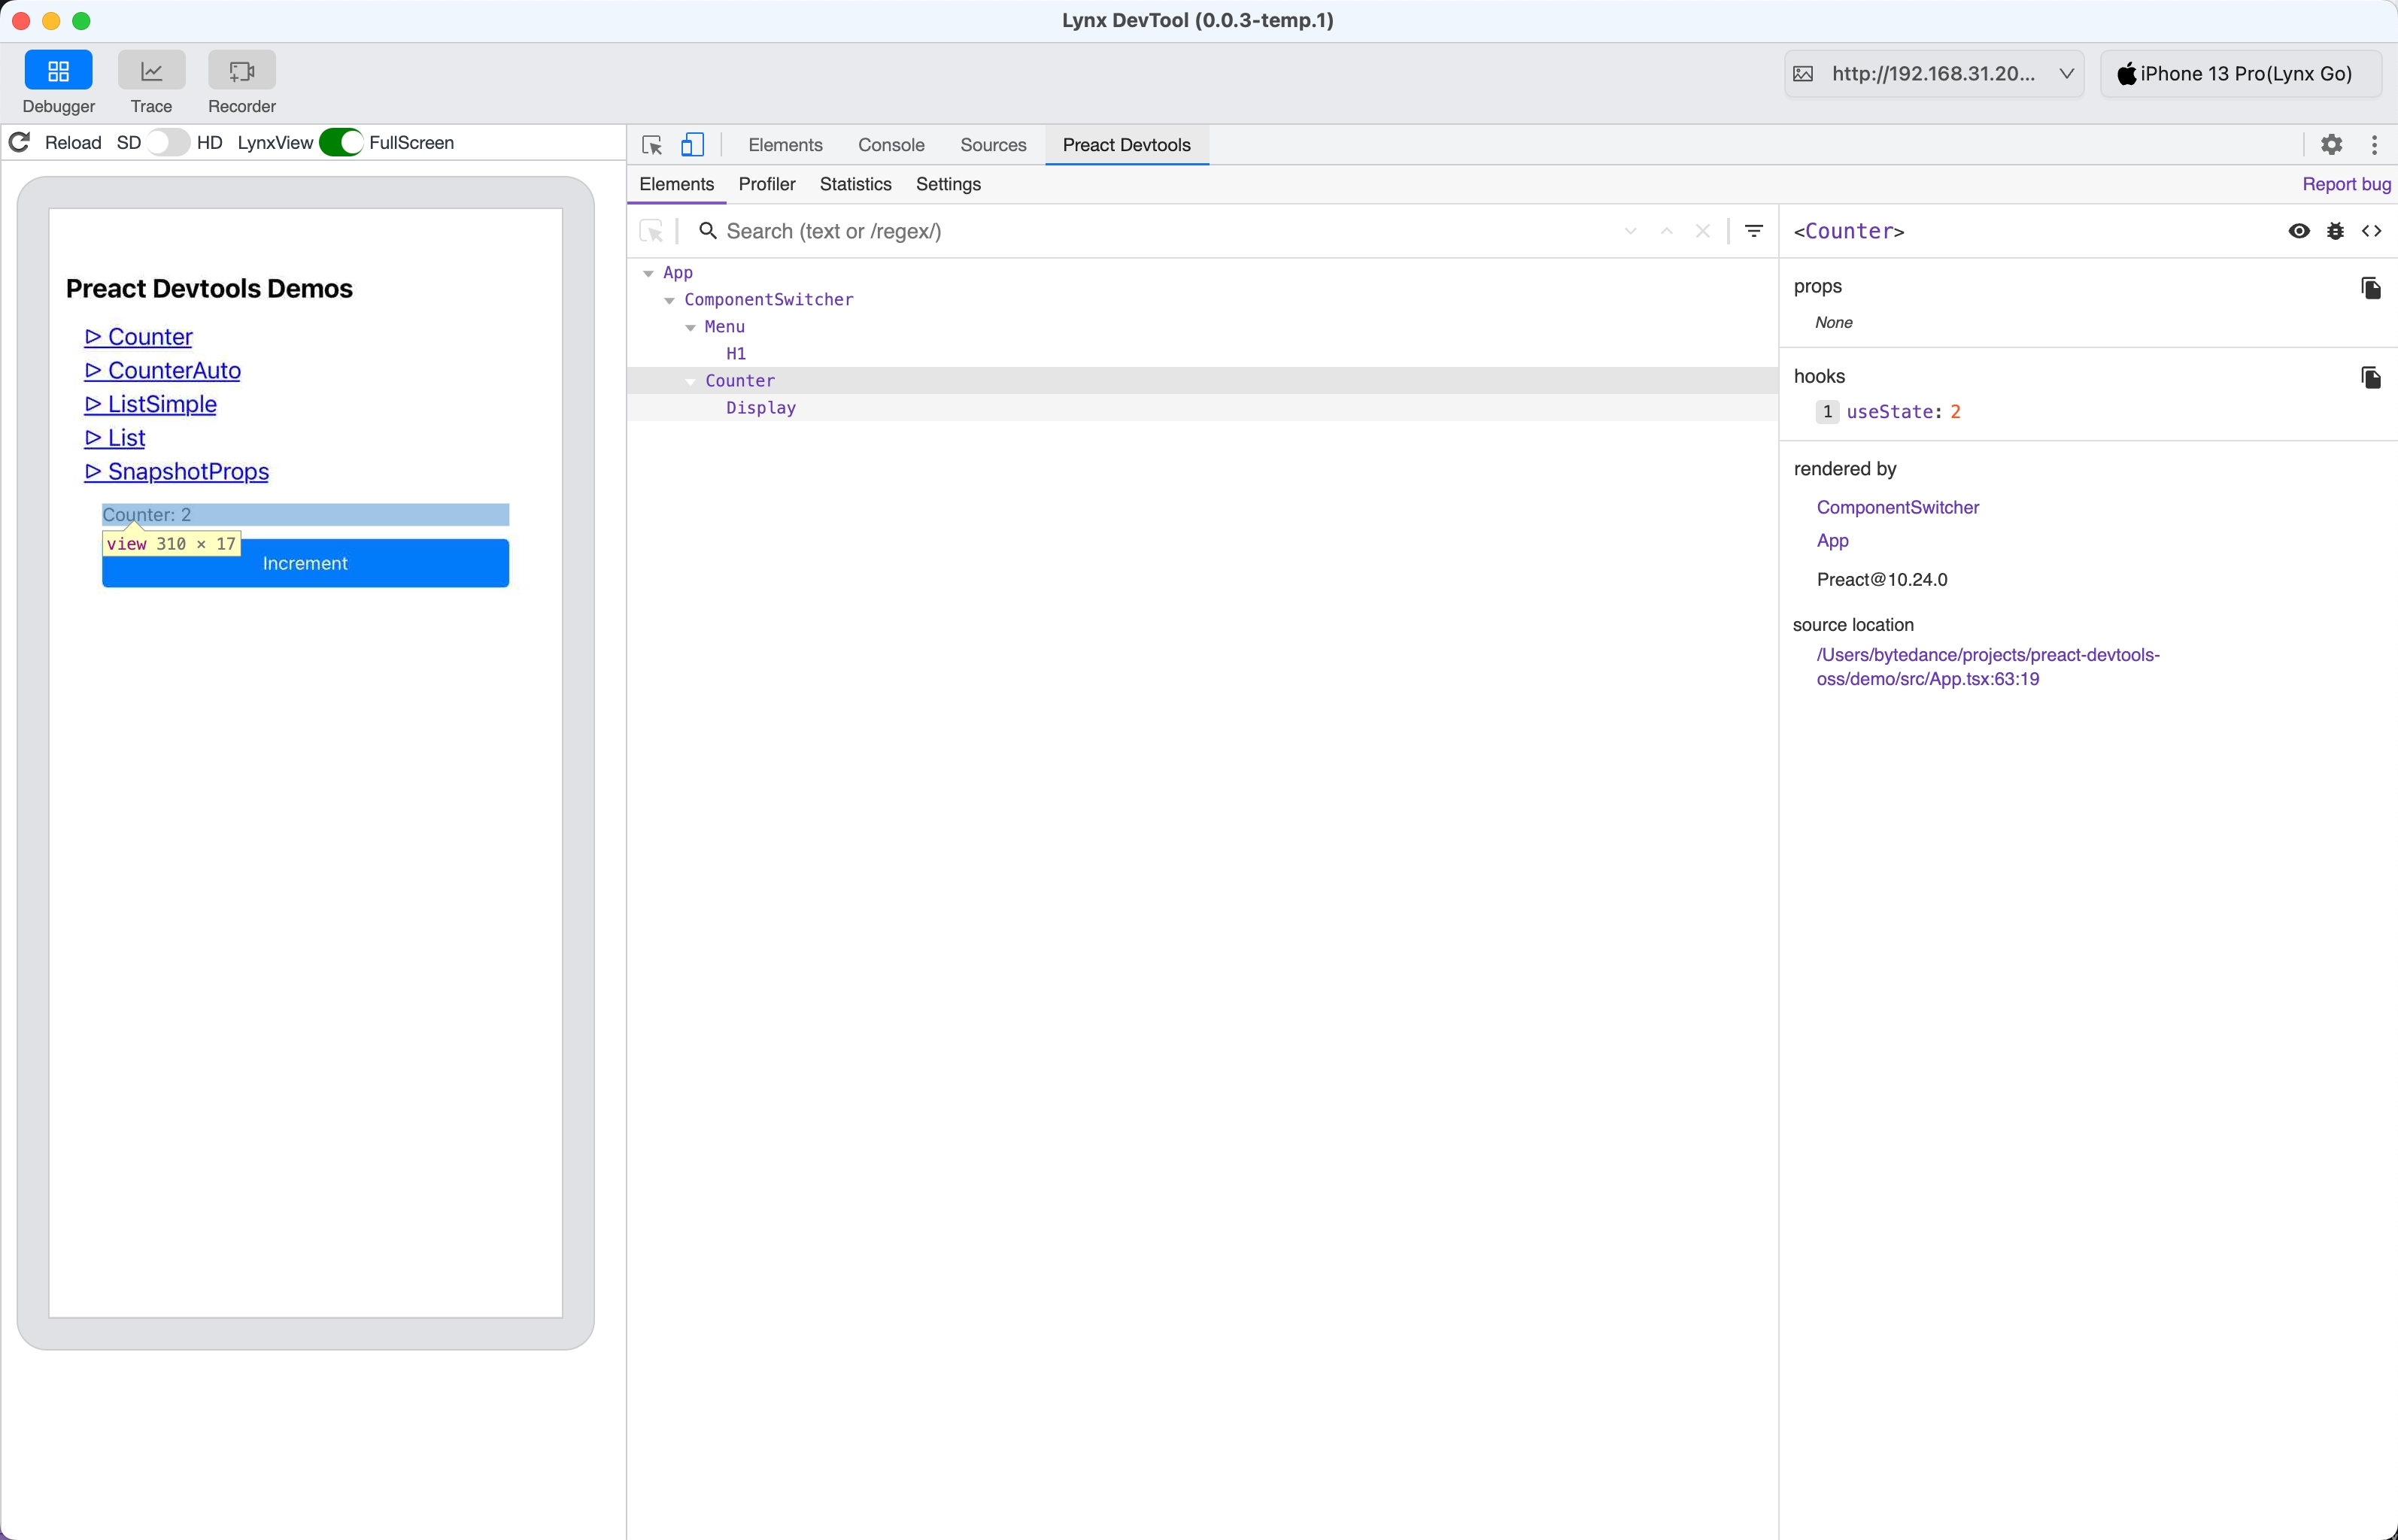
On the right side of the Preact Devtools panel, you can directly modify the props or state of components, and the ReactLynx application's UI will update in real-time.
As shown below, we changed the state used for counting in the Counter component from 1 to 2, and the counter UI on the page also changed from 1 to 2.
ClickToComponent for Source Navigation
We integrated the ClickToComponent into the Preact Devtools panel. By clicking the file path under source location, VSCode will automatically open the file containing the component and navigate to the corresponding line and column.
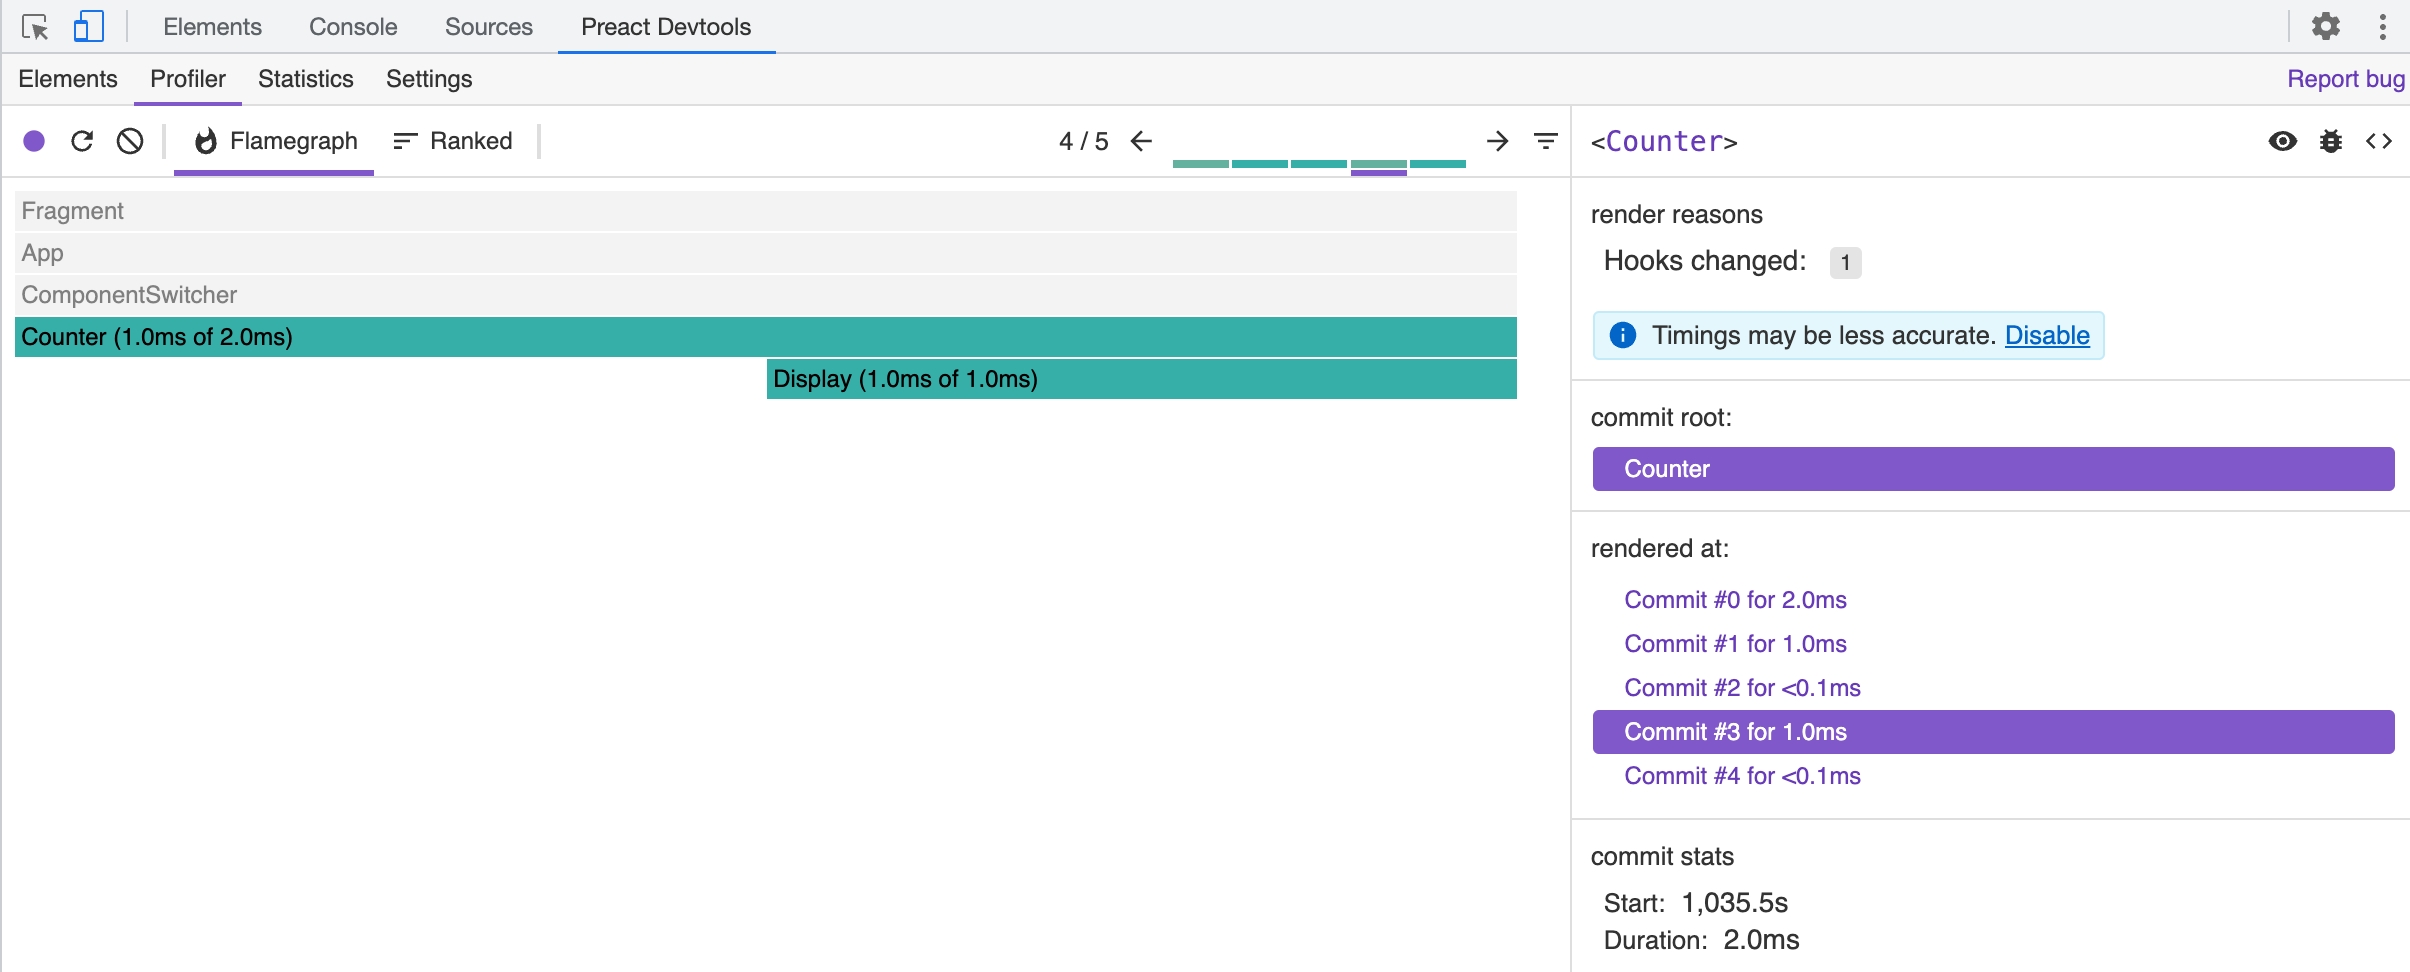
Profiler
The Profiler panel supports performance analysis of ReactLynx component rendering time on background thread. Click the button in the top-left corner to start recording, let the application run for a while, and then click the button again to stop. You will then get information about all Preact commits during that time, as well as the rendering time of each component within the same commit.