Analysis JavaScript
Lynx Trace supports recording detailed JavaScript profile data, allowing you to analyze scripts execution performance within your application.
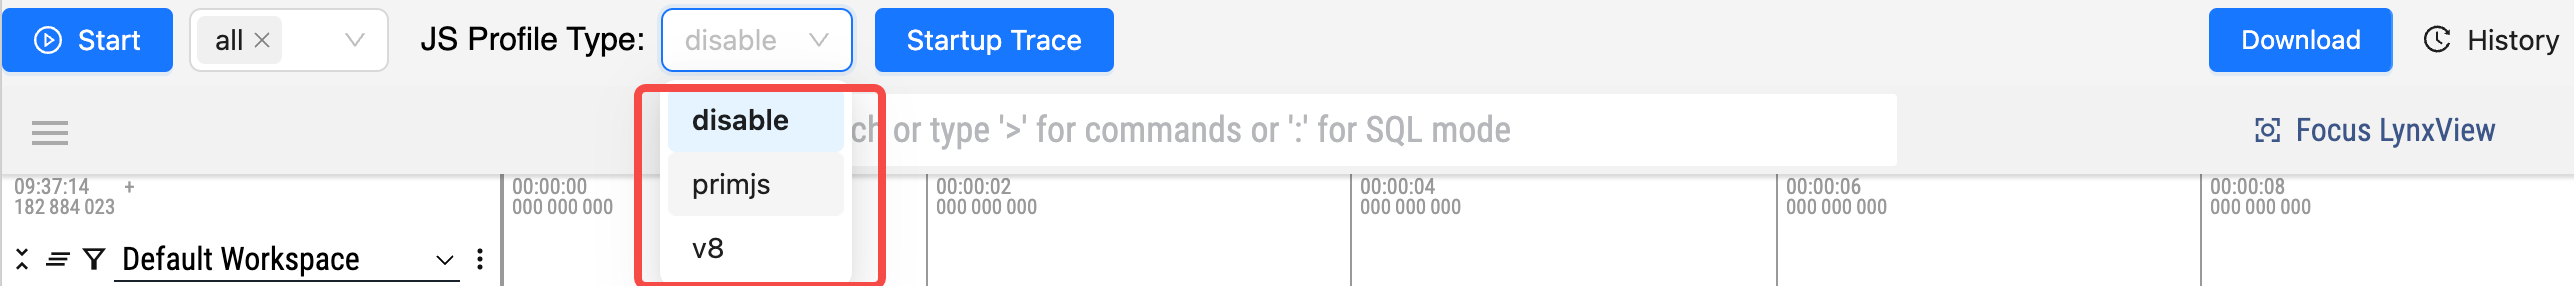
1. Click JS Profile and Select the correct scripts engine
Based on the background thread scripts engine used by your Lynx page, choose the appropriate value in the JS Profile selection.
- disable: Do not enable JavaScript profiling;
- primjs: Enable profiling for the PrimJS JavaScript engine.
- v8: Enable profiling for the V8 JavaScript engine.
2. Start recording
Click Start to begin recording trace.

3. Stop recording
When finished, click Stop to end the recording.

4. Decode JavaScript Profile Data using sourcemap (Optional)
If your scripts is minified, you can use sourcemap to decode profile data.
FAQ
No JavaScript profile data after recording trace
- Make sure you have selected the correct script engine before starting recording.
- On iOS, ensure both Lynx Devtool and PrimJS Debugging are enabled.
No scripting resource found after clicking SourceMap Decode
- Ensure you start trace recording before opening the Lynx page so that the script resource name can be captured.
Except as otherwise noted, this work is licensed under a Creative Commons Attribution 4.0 International License, and code samples are licensed under the Apache License 2.0.