Record Trace
Lynx Trace is a performance analysis tool for Lynx applications. It records detailed trace events throughout the rendering pipeline and the internal execution of the Lynx engine.
Using Lynx Trace, developers can capture, inspect, and analyze the timing and sequence of operations, making it easier to identify performance bottlenecks, long tasks, and other performance issues.
Setup
- Install Lynx Devtool Desktop Application;
- Use the latest LynxExplorer app or integrate lynx dev version into your application;
- Use a data cable to connect your device to your computer;
Record Trace
1. Select Lynx Trace
Open the Lynx Devtool desktop application and choose Trace from the topbar.

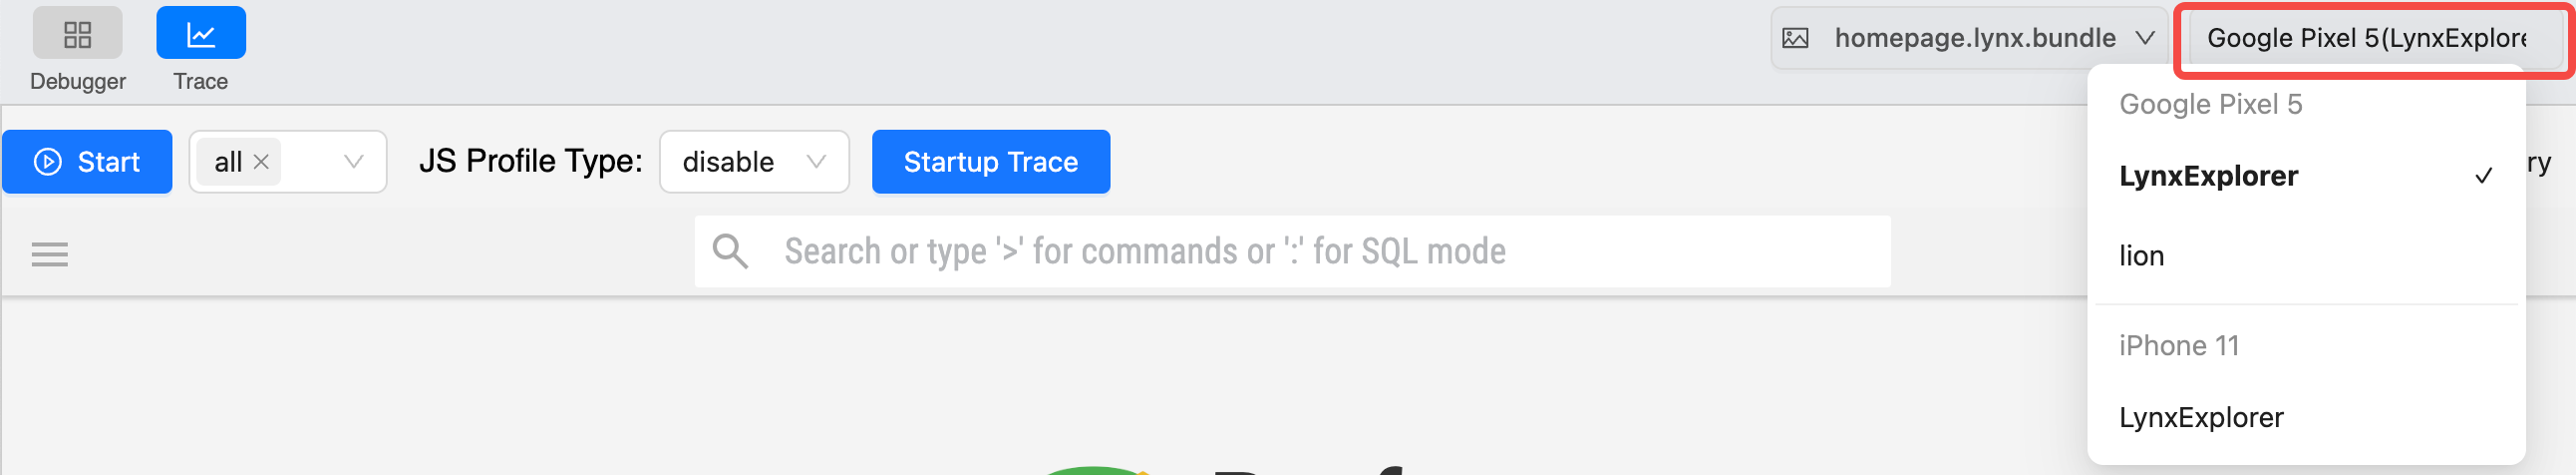
2. Select the app
Pick the target app you want to profile from the available device list.
3. Start recording
Press the Start to start recording trace.

4. Stop recording
Click the Stop to stop recording trace.

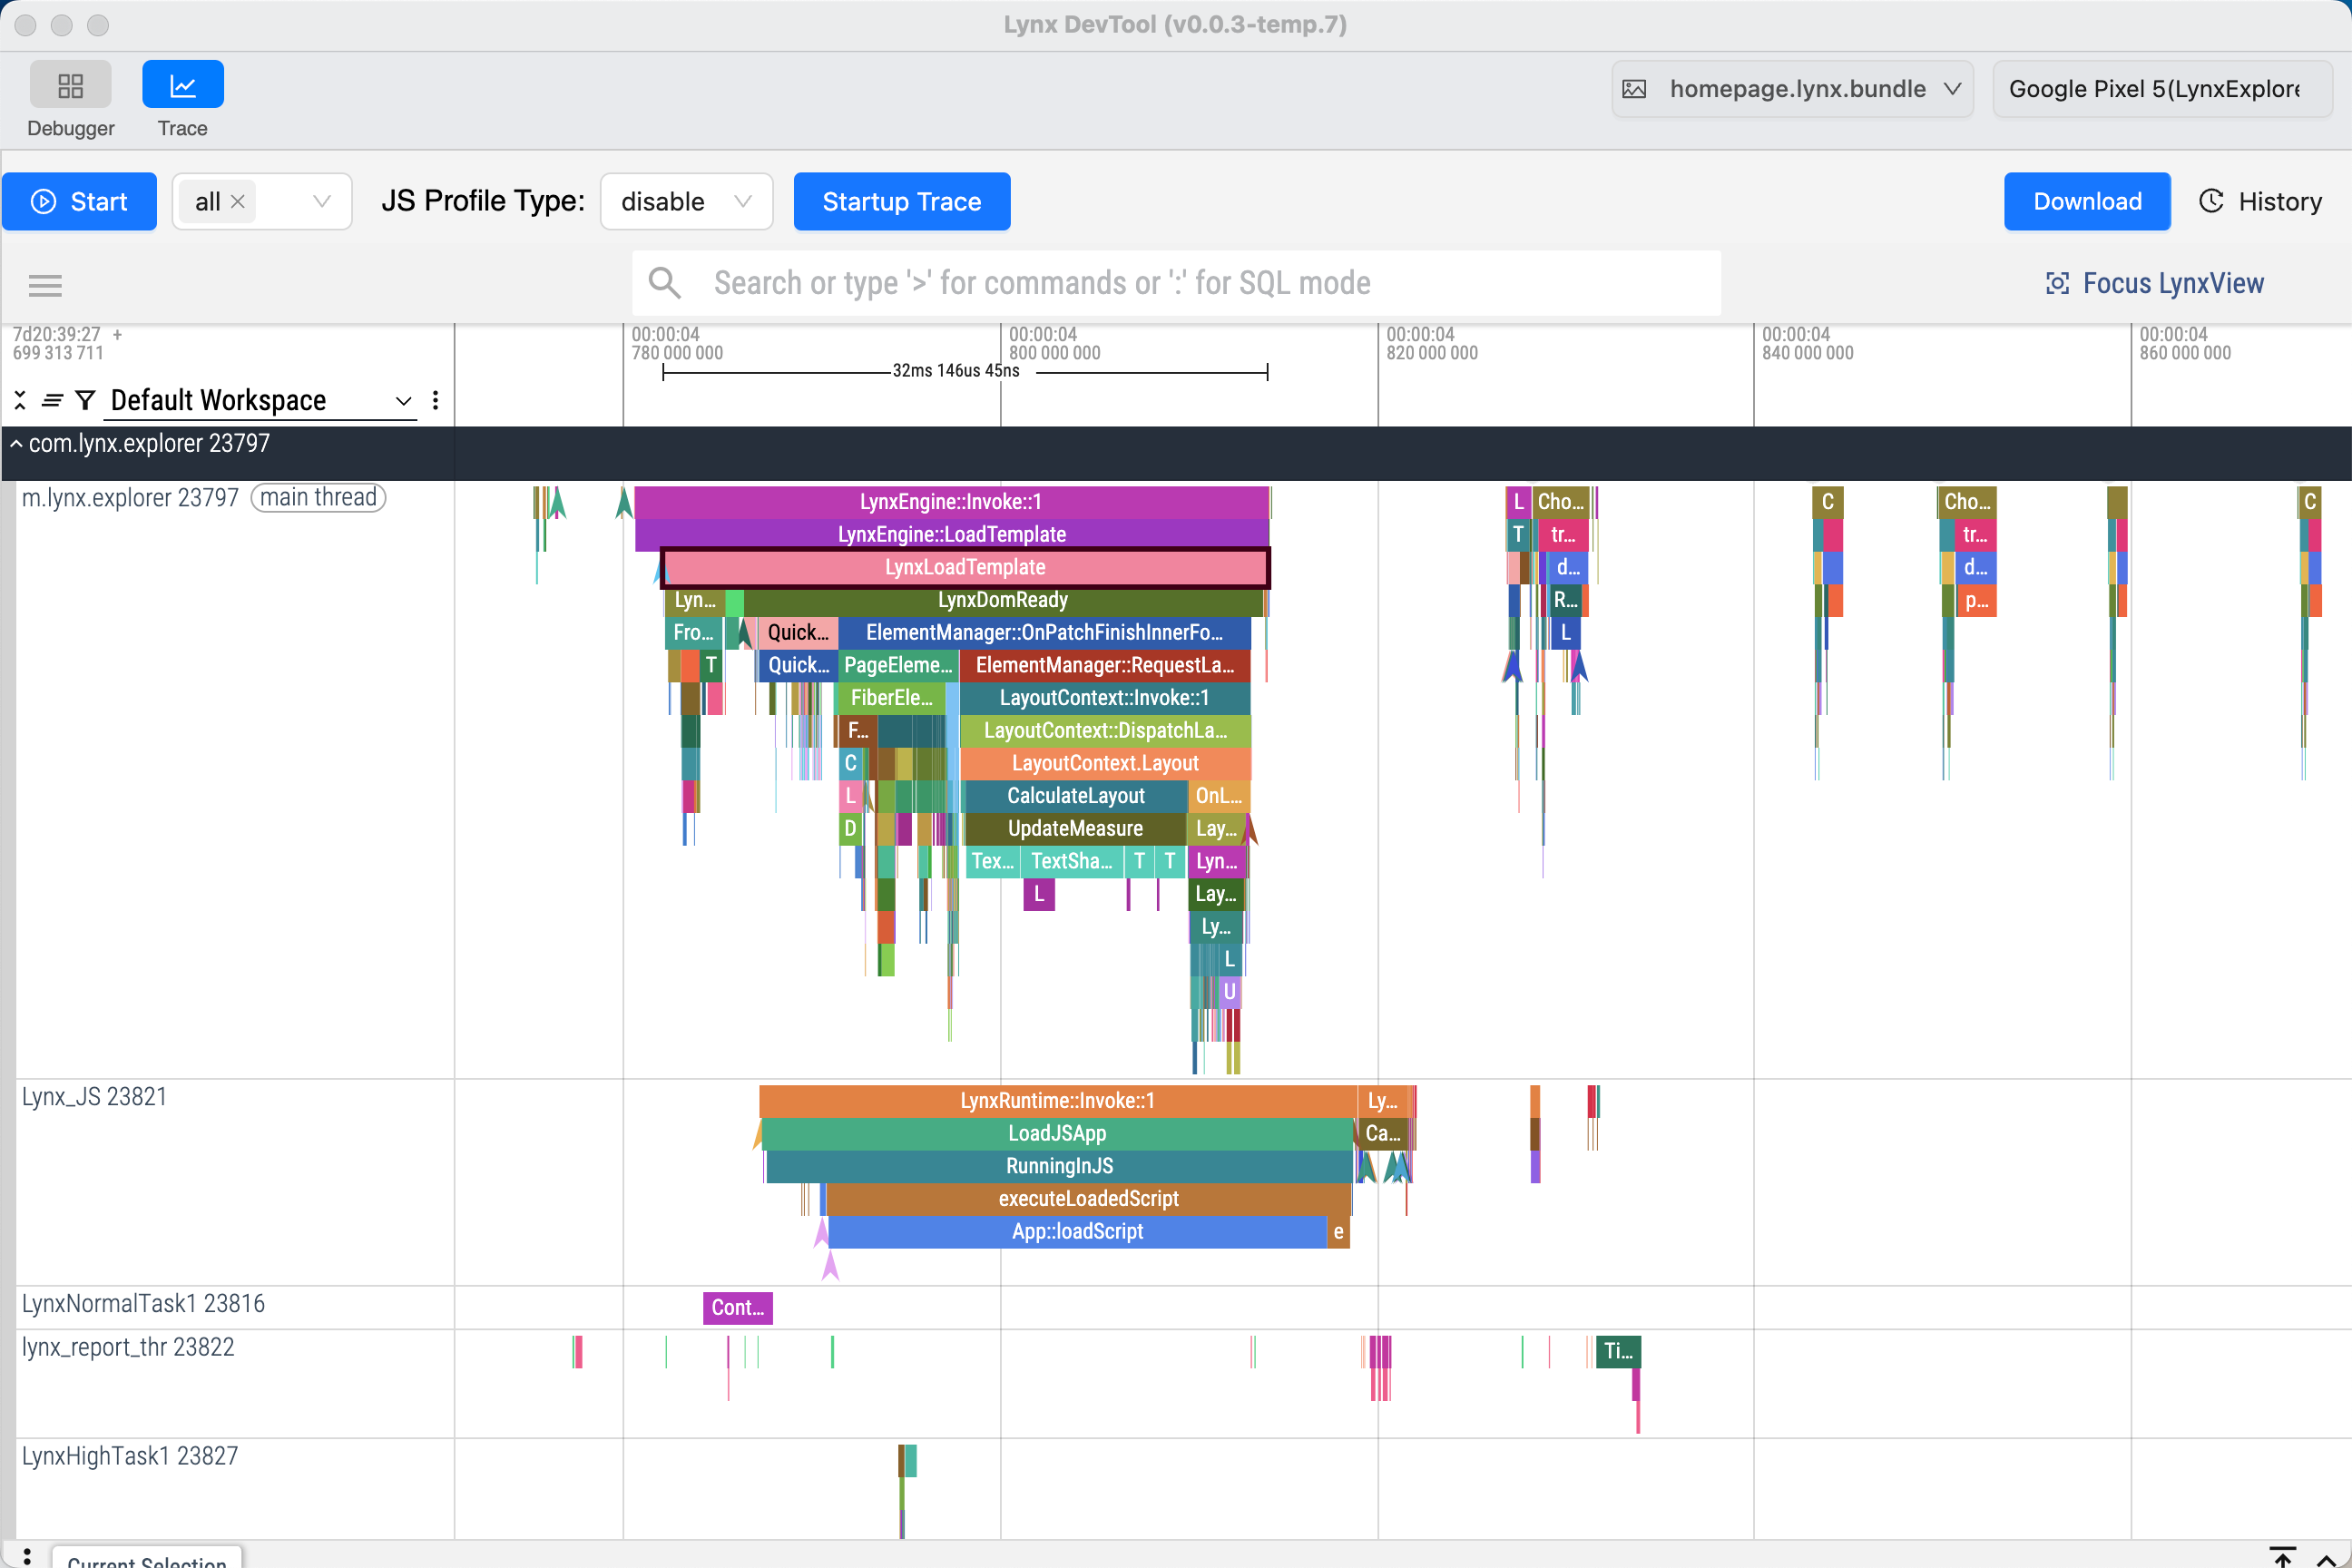
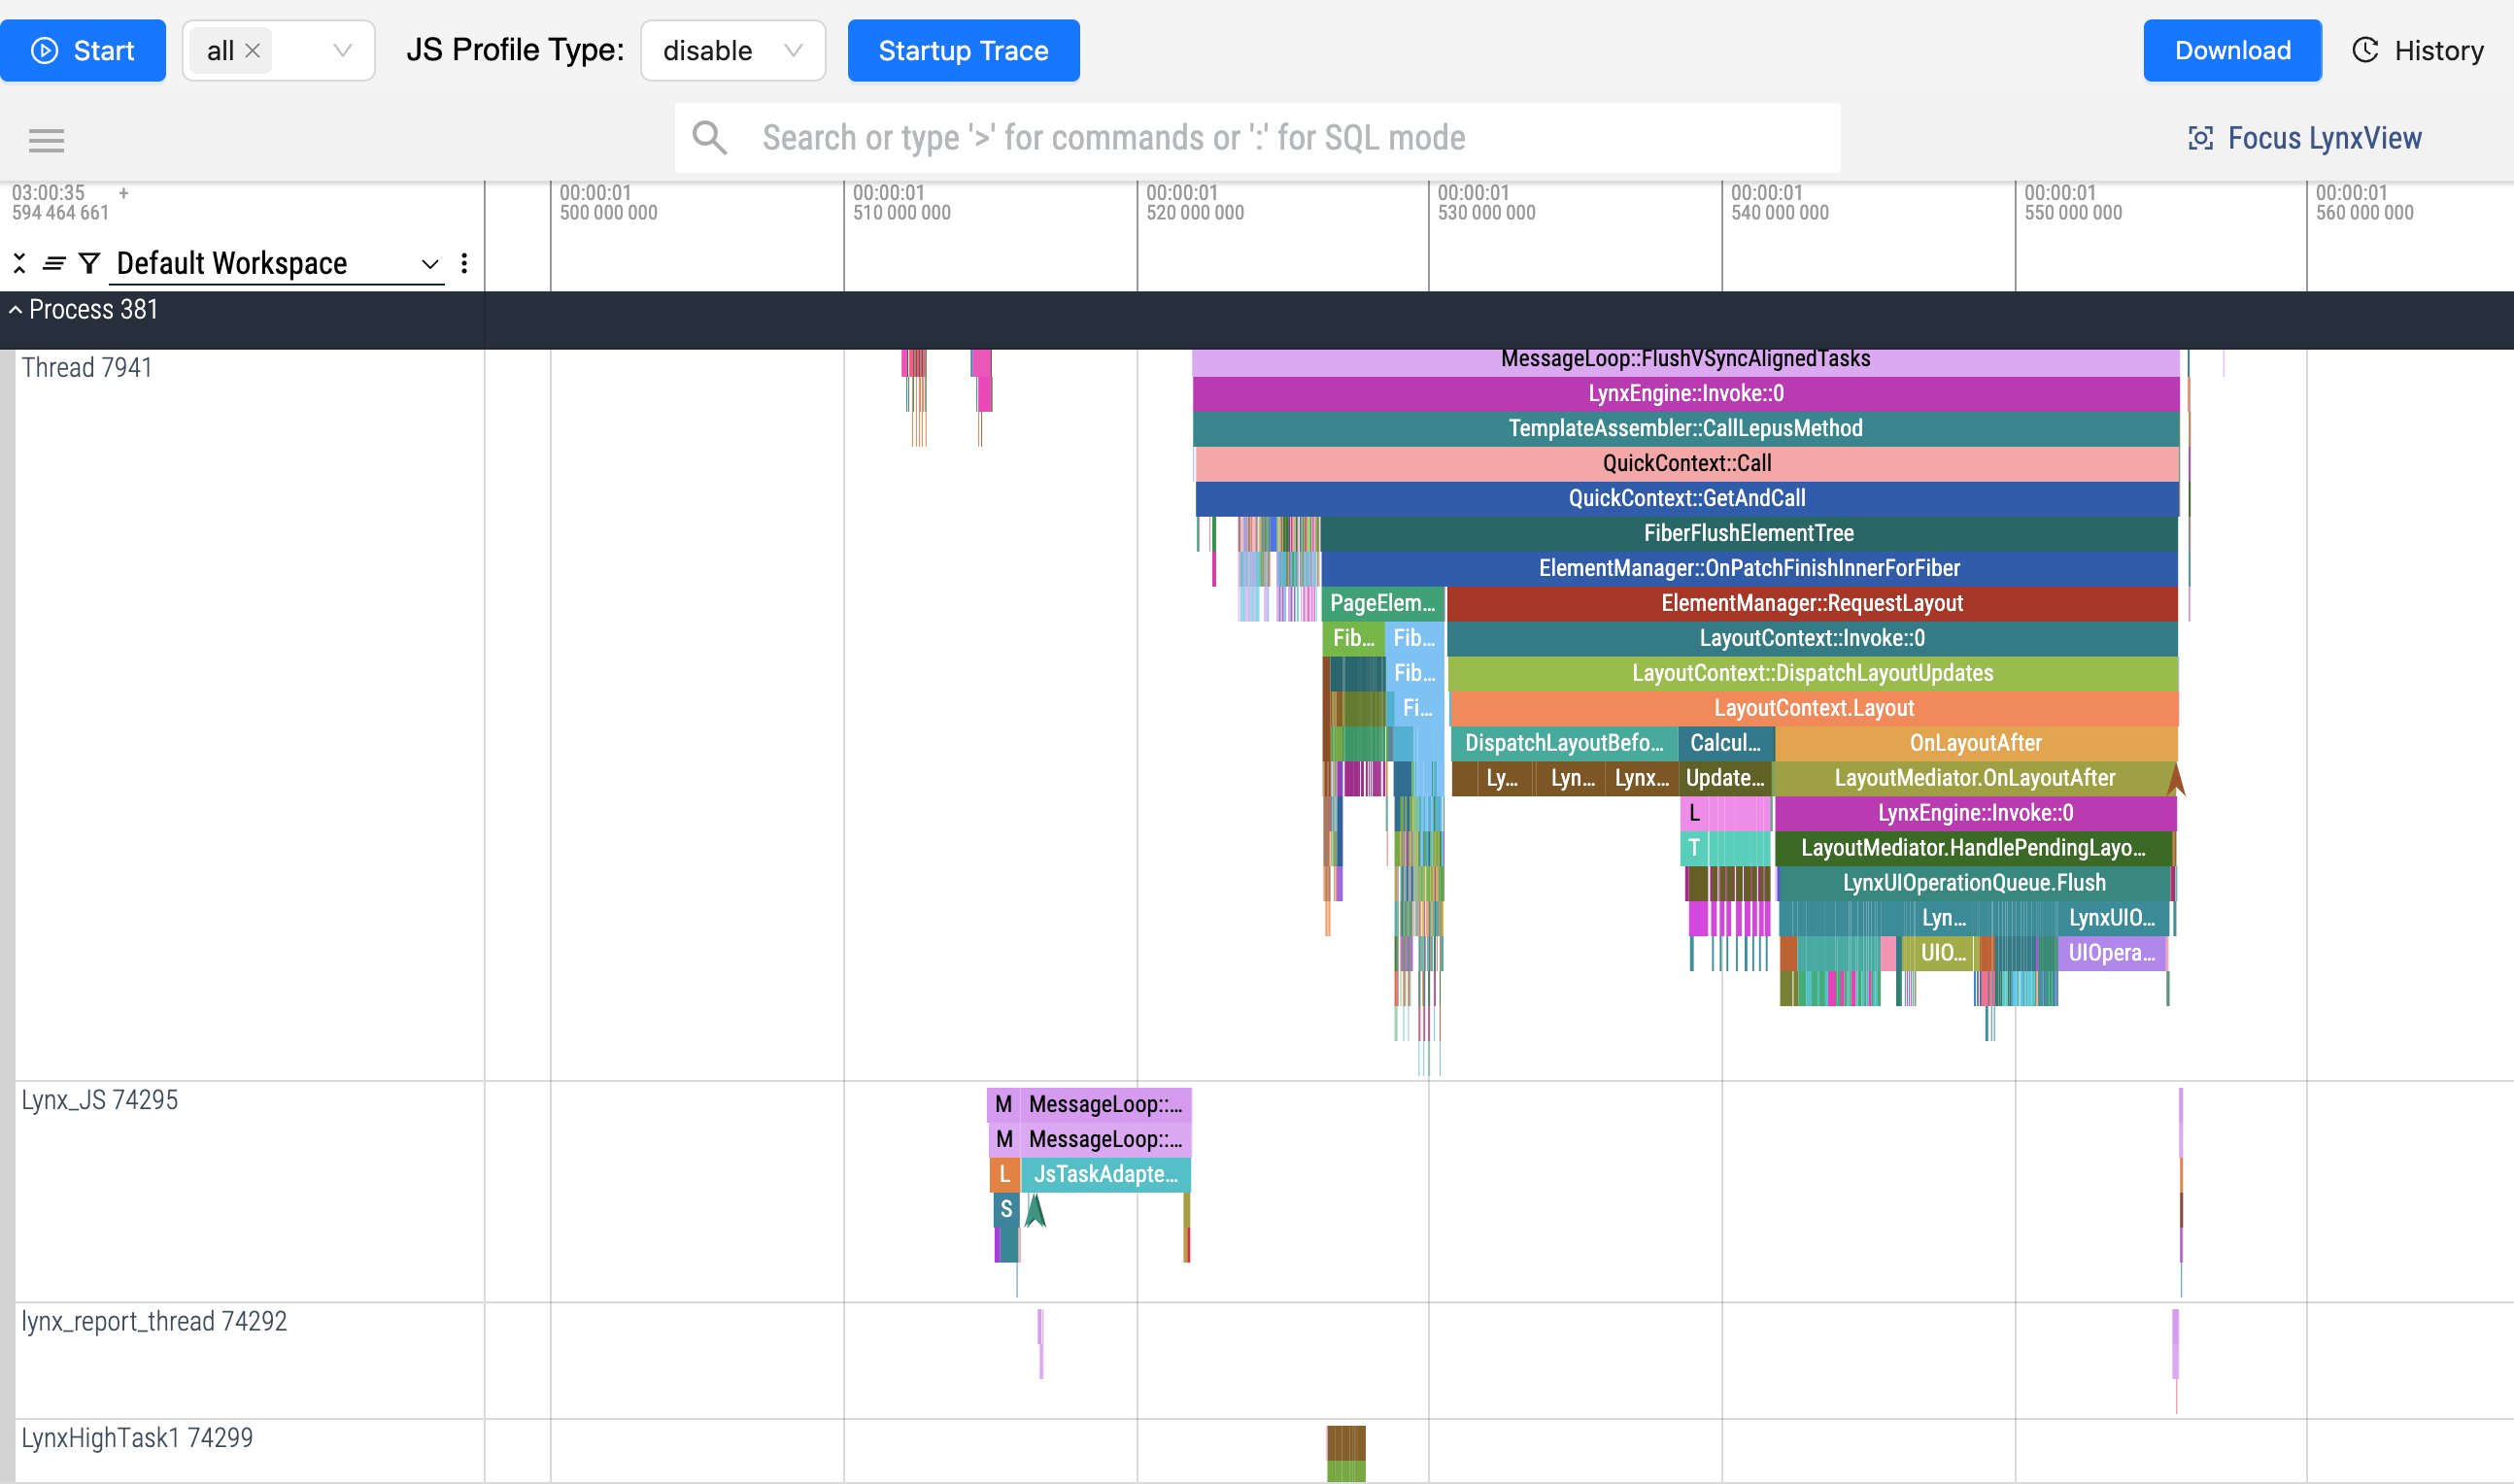
5. Analyze
After stopping, the trace data will be displayed for analysis.
6. Download trace data(optional)
If needed, click the Download to save the trace file to your computer.

7. View or manage historical trace data
Click History to see previous trace data.

You can select a trace file to view, download, or delete as needed on Trace History panel.
FAQ
After clicking Start, the message "Current app does not integrate lynx and lynx-trace components with dev version, please integrate dev version first according to the following document" appears.
- Use the latest LynxExplorer app, or refer to integrate lynx dev version to integrate the dev version of lynx.
After clicking Start, the message "Tracing already started" appears.
- Trace recording is already in progress. You can click Stop to stop recording trace.